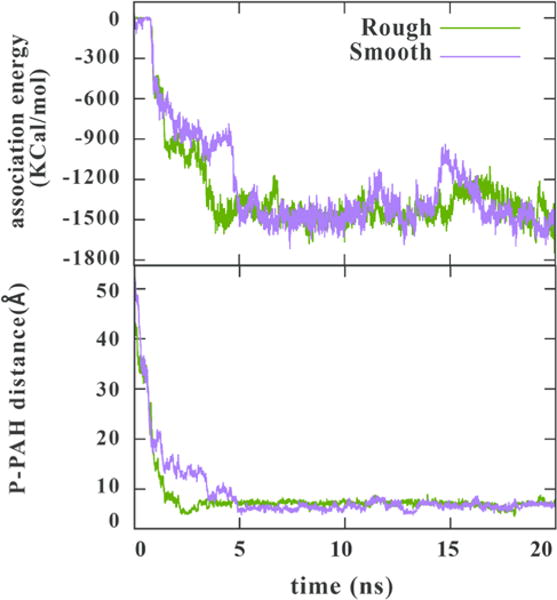
Figure 6.

Electrostatic energies of the LPS/PAH association (top) and the distance between a selected phosphorus on LPS to the PAH center of mass (bottom) during a 20 ns simulation of 10-mer PAH interacting with the rough (green) and smoother (yellow) LPS constructs from P. aeruginosa shown in Fig. 2. (Note that the electrostatic energy trace for rough LPS is recapitulated from Fig. 5 to facilitate interpretation.)
