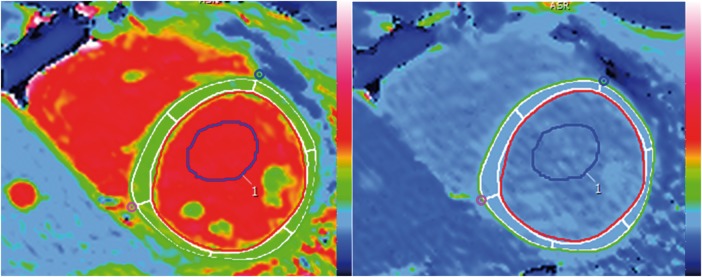
Figure 1.
Example of myocardial and blood ROIs in ShMOLLI native (left) and post-contrast (right) T1 maps. Manual epicardial (green) and endocardial (red) contours with 10% erosion offset (white borders) drawn in the native ShMOLLI T1 map (left) and exported on to the post-contrast map (right) are shown. The myocardial ROI is segmented according to the AHA model. A blood ROI was also drawn in the native T1 map and copied on to the post-contrast map.

