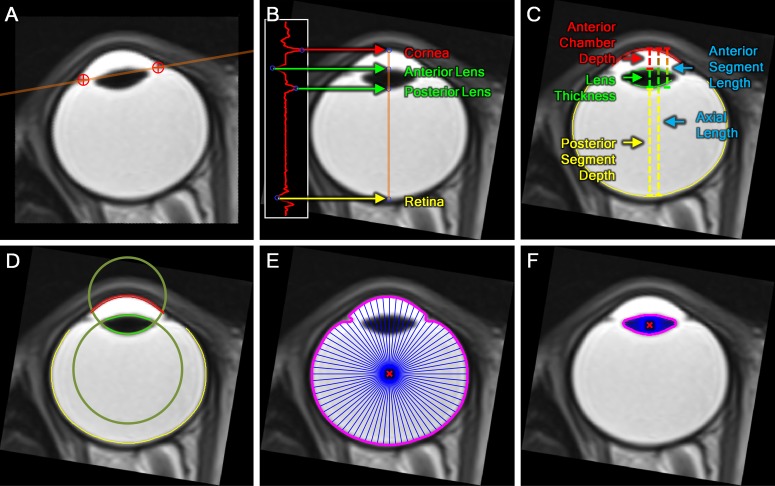
Figure 1.
The MRI analysis procedure. (A) Sample MRI section exported from Voxar3D. The image must be rotated such that the plane of the ciliary body (brown line), indicated by the operator (red crosshairs), is parallel to the horizontal image axis. (B) Following image rotation, the first derivative of the brightness profile of the axis of the eye (plotted to the left) was obtained. Troughs and peaks in this profile (circles), which corresponded to the cornea, anterior lens, posterior lens, and retina, were automatically identified. (C) From the positions of the identified features, ACD, LT, and PSD were calculated. Corresponding surfaces also were identified (red, cornea; green, lens; yellow, retina). (D) Circles were fit to the anterior and posterior cornea (not shown) and lens (shown) to determine radii of curvature. (E) Rays from the centroid of each eye (red X) were measured to the inner edge of the eye (magenta line) every 5°. (F) This process was repeated for the lens.

