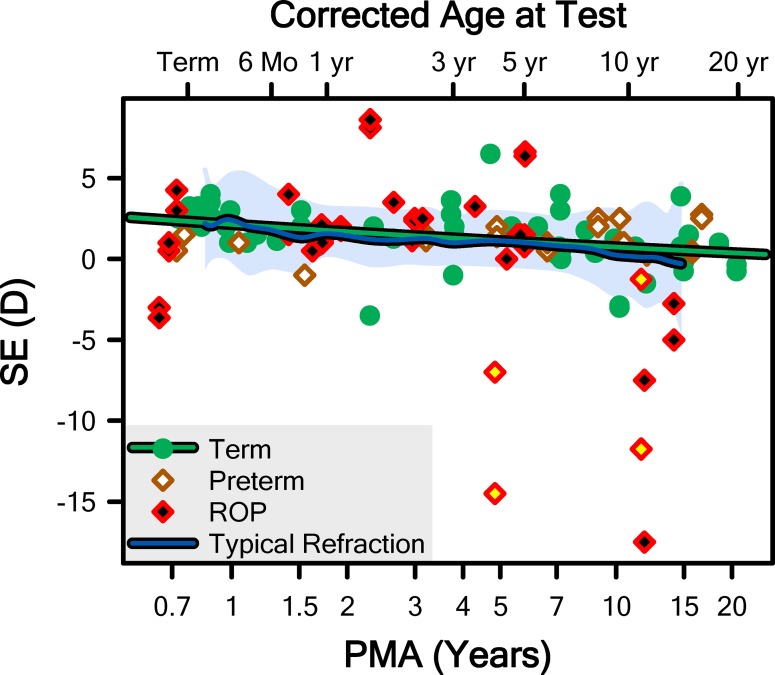
Figure 3.
The SE refraction, from the 75 subjects for which this information was available, plotted as a function of postmenstrual age. The mean (blue line) and 5th to 95th prediction interval (pale shaded region) for “typical refraction” was obtained from Mayer et al.36 and the CLEERE study group.37 The green line is the fit of the Term data with Equation 1. The data from the eyes of two ROP subjects with the longest observed axial lengths (Fig. 5) are noted (yellow fills); these subjects were excluded from the fit and all subsequent analyses. Corrected age was calculated as the sum of PMA and 10/13ths of a year (i.e., 40 weeks).

