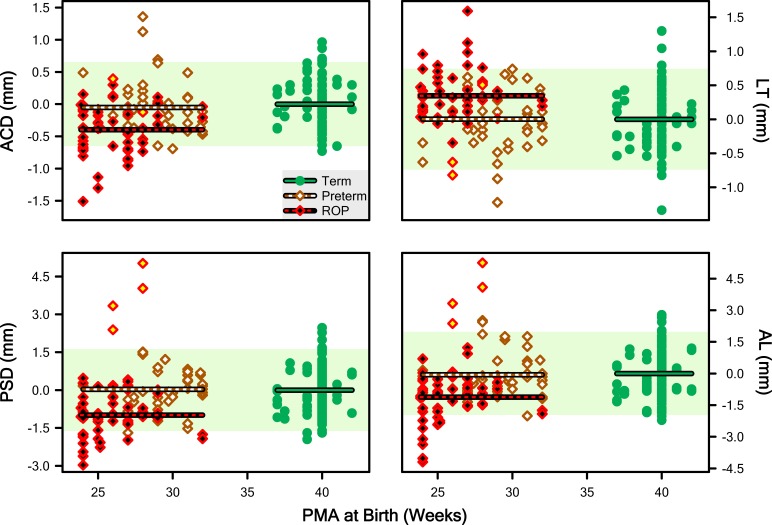
Figure 5.
“Abnormality” scores for ACD, LT, PSD, and AL calculated by taking the difference between each point (minuend) in Figure 4 and the point on the regression line for Term subjects at the same age (subtrahend). Lines plot the mean abnormality for the Term, Preterm, and ROP groups. The pale shaded region indicates the 5th to 95th prediction limit for Term abnormality.

