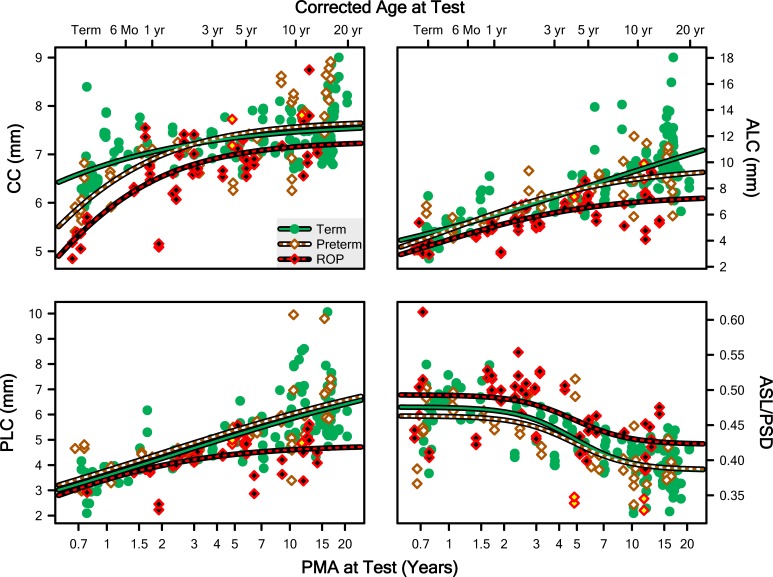
Figure 6.
Measurements from both eyes of every subject plotted as a function of PMA for CC, ALC, PLC, and the ratio of the ASL to PSD (ASL/PSD). The lines are fits of the data of the Term, Preterm, and ROP groups with Equation 1 with y0 fixed at 0, except at the bottom right, where y0 was free to vary.

