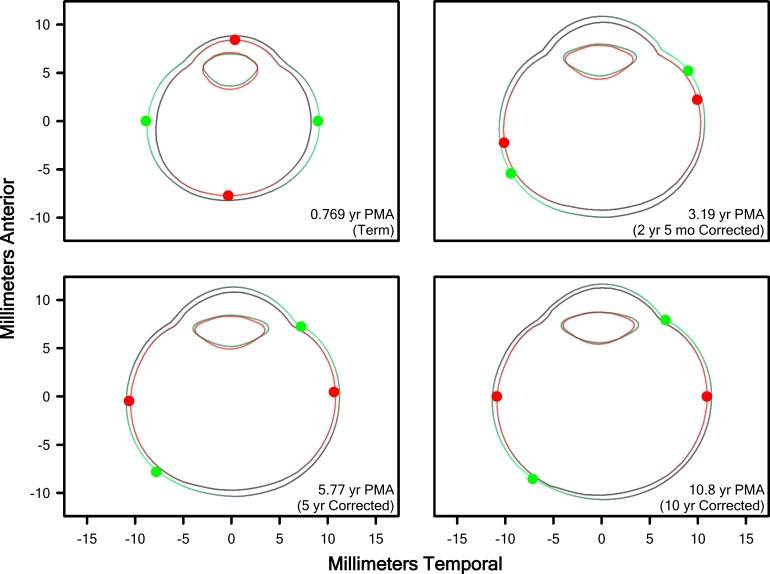
Figure 8.
Model eye and lens cross-sections from Term (green) and ROP (red) eyes at the ages indicated. Preterm eyes were nearly indistinguishable from Term eyes and are excluded for clarity. Dots indicate the θs of maximal growth, G(x) (Equation 7). Areas of bright color on the eyes indicate regions for which the model indicated the highest growth, while black areas are those the model indicated were growing more slowly; brightness is normalized at each age to the areas of highest and lowest growth, but growth was overall slower at older ages (as evidenced by the decreasing change in size with increasing age).

