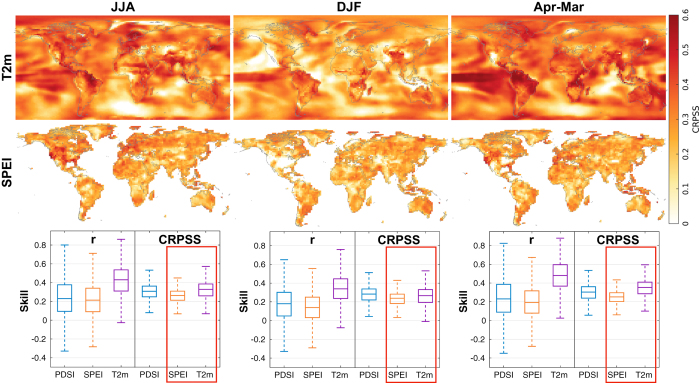
Figure 2. Skill assessments for the temperature and hydroclimate reconstruction products computed over the years 1901–2000.
The top row shows the mean continuous ranked probability skill score (CRPSS) for the 2 m temperature reconstruction (T2m). CRPSS is computed for each grid point time series with the observational temperature dataset of Berkeley Earth45. The middle row shows the CRPSS for the standardized precipitation-evapotranspiration index (SPEI). The observational SPEI is computed with a 12-month decaying exponential kernel and using the CRU TS3.23 land surface datasets69. The bottom row summarizes the spatial skill values from the top two rows (orange and purple CRPSS box plots contained within the red boxes) as well as corresponding CRPSS assessments for the Palmer drought severity index (PDSI) and also correlation (r) skill values over the same time period. For the PDSI assessments, we use the observational product of ref. 62.

