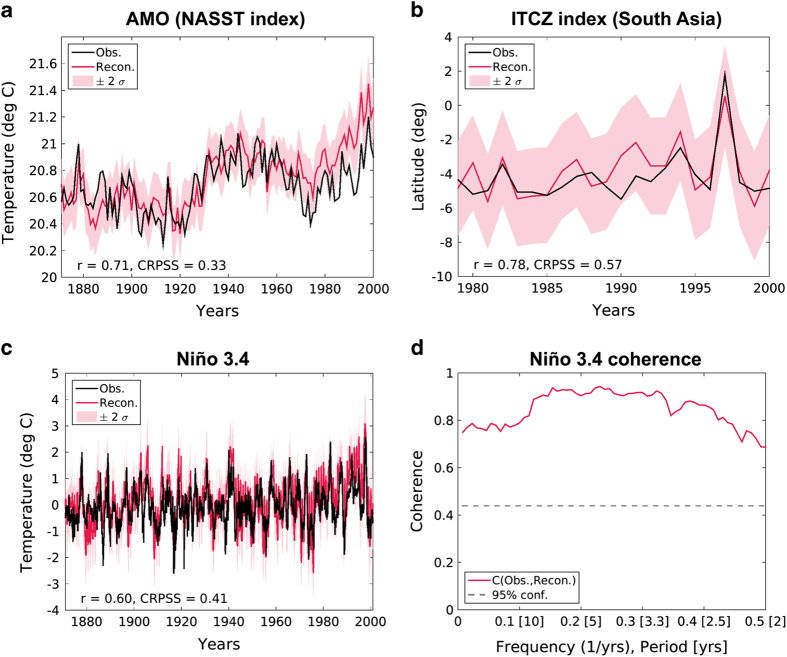
Figure 4. Reconstruction verification for three representative climate-dynamical indices.
(a) Verification of the annual mean North Atlantic sea surface temperature index (NASST), which is the non-detrended, non-smoothed version of the Atlantic multidecadal oscilation (AMO). This panel includes the AMO observations (Obs.) 76 and the mean reconstruction (Recon.) with a corresponding ±2σ range of the posterior ensemble. Skill values are indicated for correlation (r) and the mean continuous ranked probability skill score (CRPSS) in the bottom left corner. These skill values are computed over the entire time interval shown. (b) Reconstruction verification of the location of the annual mean intertropical convergence zone (ITCZ) over the South Asian monsoon region spanning the tropics from 65°E to 95°E. The observational ITCZ is computed using the Global Precipitation Climatology Project version 2.3 (ref. 46) available back to the year 1979. Skill values of r and CRPSS are computed over the time interval shown here. (c) Reconstruction verfication for the monthly Niño 3.4 index, similar to (a) and (b). The observational Niño 3.4 index is computed from Berekley Earth surface temperature dataset45, which over the ocean is based on HadSST77. (d) Coherence as a function of frequency and period between the mean Niño 3.4 reconstruction and the observations shown in panel (c).

