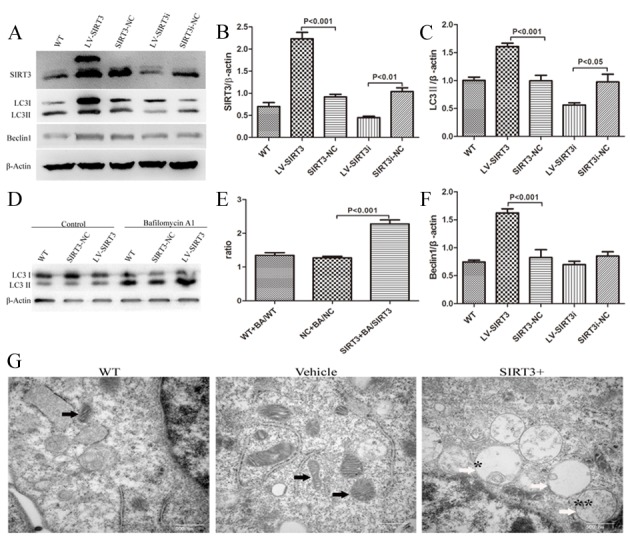
Figure 2.

SIRT3 increases autophagy in human neuroblastoma SH-SY5Y cells. Lysates from cells untreated, or treated with SIRT3-NC or SIRT3i-NC (non-targeting lentivirus), LV-SIRT3 (Lentivirus with a SIRT3 overexpression gene) or LV-SIRT3i (Lentivirus with a SIRT3 silencing gene) were prepared and analyzed by western blotting. (A) SIRT3 overexpression and silencing using lentiviruses were identified by SIRT3 immunoblotting with an antibody against SIRT3. Autophagy induction by SIRT3 was determined by the LC3II and Beclin1 protein levels with an antibody against LC3B and Beclin 1. β-actin is used as a loading control. Mean ± SEM, n=3. Bar graphs show the quantification of the relative levels of SIRT3 (B), LC3II (C) and Beclin 1 (F). (D) SH-SY5Y cells with or without SIRT3 overexpression were treated with 100 nM Bafilomycin A1 for 100 min. Cell lysates were prepared and analyzed by western blotting. (E) Bar graphs show the quantification of LC3II level ratios between WT+BA and WT, Vehicle+BA and Vehicle, SIRT3+BA and SIRT3 groups. β-actin is used as a loading control. Mean ± SEM, n=3. (G) Ultrastructural SH-SY5Y cells in WT, Vehicle (NT-lentivirus) and LV-SIRT3 (SIRT3+) groups. Black arrows indicate mitochondria. White arrows show different stages of autophagic vascuoles: * represents an early autophagic vacuole (AVi); ** represents a degradative autophagic vacuole (AVd). An AVi can be identified by its contents (morphologically intact cytoplasm). The AVd contains partially degraded contents. Scale bars, 500 nm.
