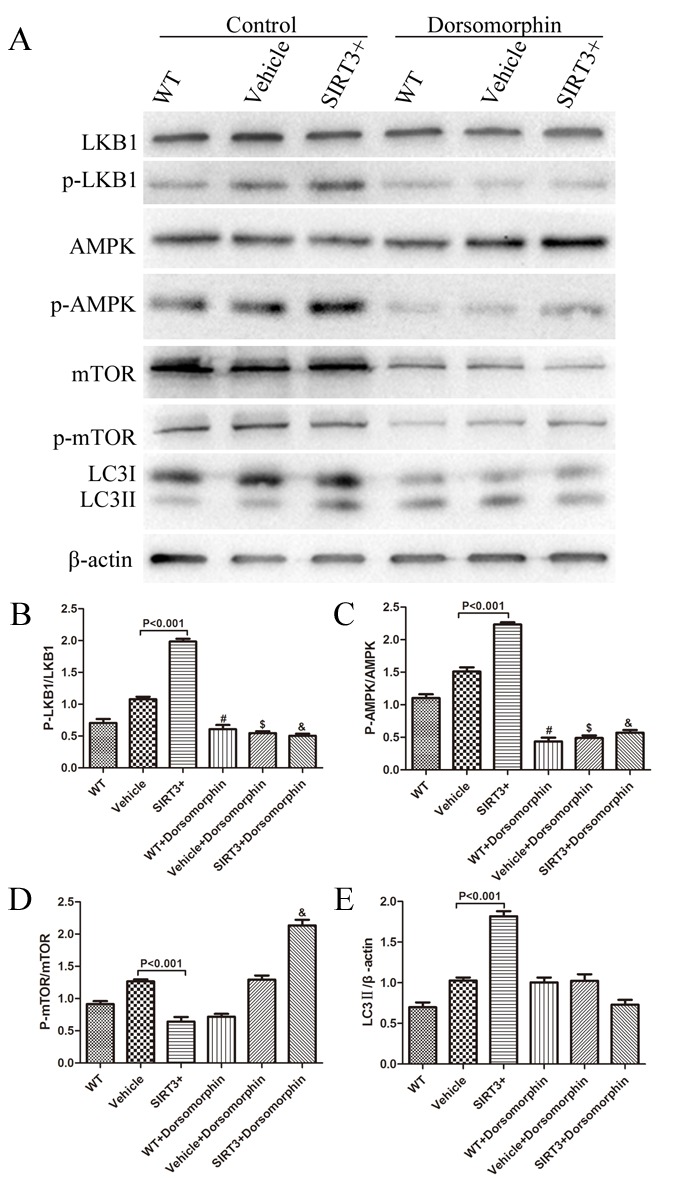
Figure 6.

SIRT3 induces autophagy through the LKB1-AMPK-mTOR pathway. (A) The SH-SY5Y cells with or without SIRT3 overexpression were treated with 40 μM Dorsomorphin or control for 100 min. The cell lysates were analyzed by western blotting with the indicated antibodies. Data show the quantification of the p-LKB1/LKB1 ratio (B), p-AMPK/AMPK ratio (C), p-mTOR/mTOR levels (D) and LC3II (E). β-actin is used as a loading control. #: P<0.001 vs. WT, $: P<0.001 vs. Vehicle, &: P<0.001 vs. SIRT3+. Mean ± SEM, n=3.
