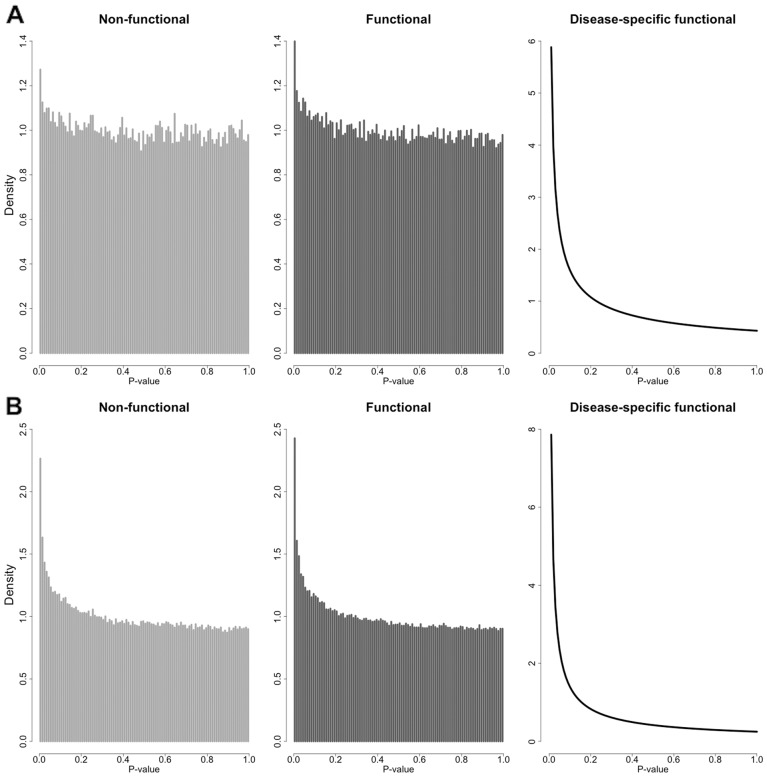
Fig. 1.
P-value densities of different subgroups of SNPs. (A) P-value histogram of non-functional SNPs (Z = 0), P-value histogram of functional SNPs (Z = 1), and estimated P-value density of disease-specific functional SNPs (ZD = 1) in the NIDDK GWAS of Crohn’s disease. (B) P-value histogram of non-functional SNPs (Z = 0), P-value histogram of functional SNPs (Z = 1) and estimated P-value density of disease-specific functional SNPs (ZD = 1) in the PGC2011 GWAS of schizophrenia

