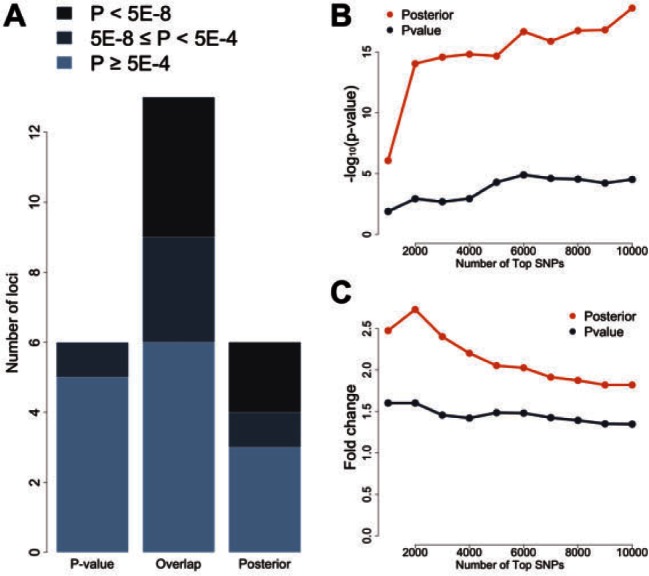
Fig. 2.

Global performance in studies of Crohn’s disease. (A) Signals at P-value-specific, overlapped, and posterior-specific loci in the IIBDGC meta-analysis. The top 20 loci based on P-values in the NIDDK study are compared with the top 20 loci based on posterior scores. Each locus is evaluated using the maximum regional signal strength in the IIBDGC meta-analysis. Darker color indicates stronger signals in the meta-analysis. (B) Enrichment of whole-blood eQTLs in the top SNPs selected based on P-value and posterior score. The vertical axis shows the transformed P-value of hypergeometric test. (C) Fold enrichment of whole-blood eQTLs in the top SNPs selected based on P-value and posterior score. The vertical axis shows the ratio of observed and expected overlaps between eQTLs and highly ranked SNPs
