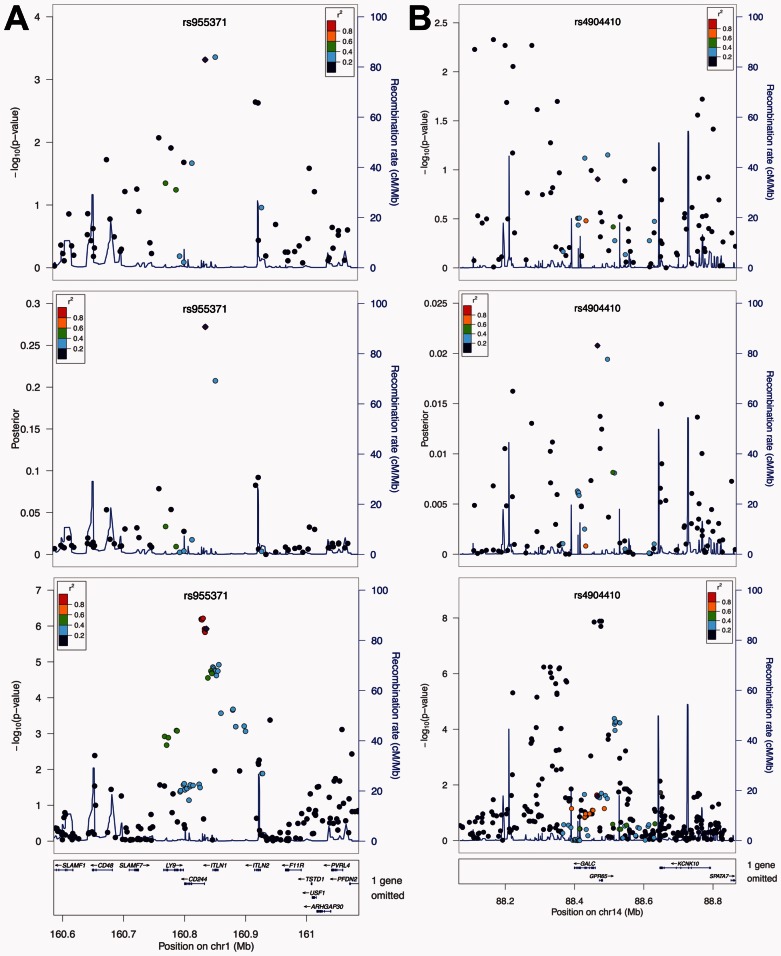
Fig. 3.
Local performance in studies of Crohn’s disease. From top to bottom, the three panels show the P-values from the NIDDK study, the posterior scores, and the P-values from the IIBDGC meta-analysis, respectively. (A) Local performance at the risk locus on chromosome 1q23. The top two SNPs at this locus in the NIDDK study are indistinguishable based on their P-values. The posterior scores suggest the importance of the SNP on the left, which is in agreement with the results from the meta-analysis. (B) Local performance at the risk locus on chromosome 14q35. Signals at this locus are weak in the NIDDK study, and the signal peak is different from that in the meta-analysis. The posterior score is able to reduce the noises caused by LD, and reveal real signals at genes GALC and GPR65. Figures are generated using LocusZoom (Pruim et al., 2010)

