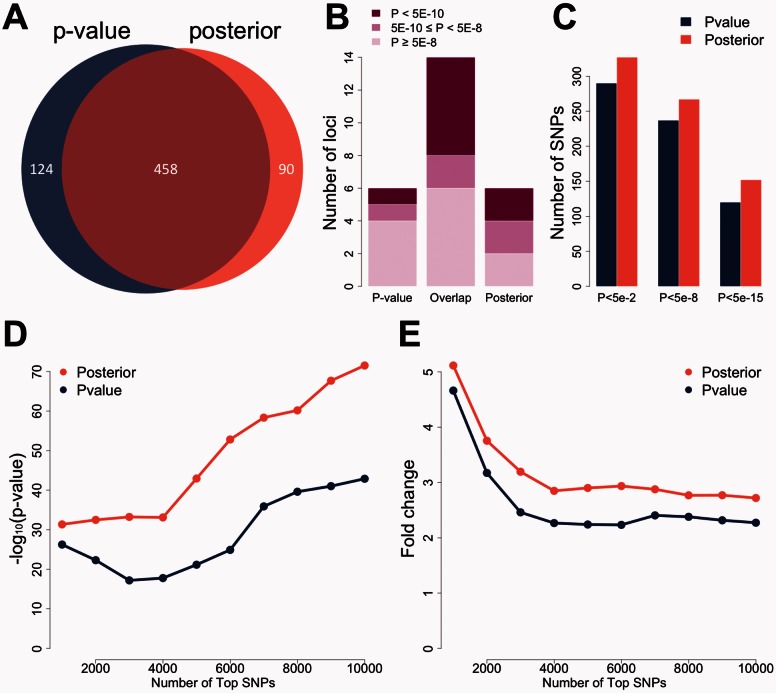
Fig. 4.
Global performance in studies of schizophrenia. (A) SNPs needed for identifying 20 loci. 582 top SNPs are needed when using P-value as the criterion. 548 SNPs are sufficient when using posterior score as the criterion. (B) Signals at P-value-specific, overlapped, and posterior-specific loci in the PGC2014 study. The top 20 loci based on P-values in the PGC2011 study are compared with the top 20 loci based on posterior scores. Each locus is evaluated using the maximum regional signal strength in the PGC2014 study. Darker color indicates stronger signals in the large study. (C) Replication rates of SNPs before and after prioritization. The top 500 SNPs under posterior scores have substantially higher replication rates than the top 500 SNPs under P-values. (D) Enrichment of whole-blood eQTLs in the top SNPs selected based on P-value and posterior score. The vertical axis shows the transformed P-value of hypergeometric test. (E) Fold enrichment of whole-blood eQTLs in the top SNPs selected based on P-value and posterior score. The vertical axis shows the ratio of observed and expected overlaps between eQTLs and highly ranked SNPs

