Figure 3.

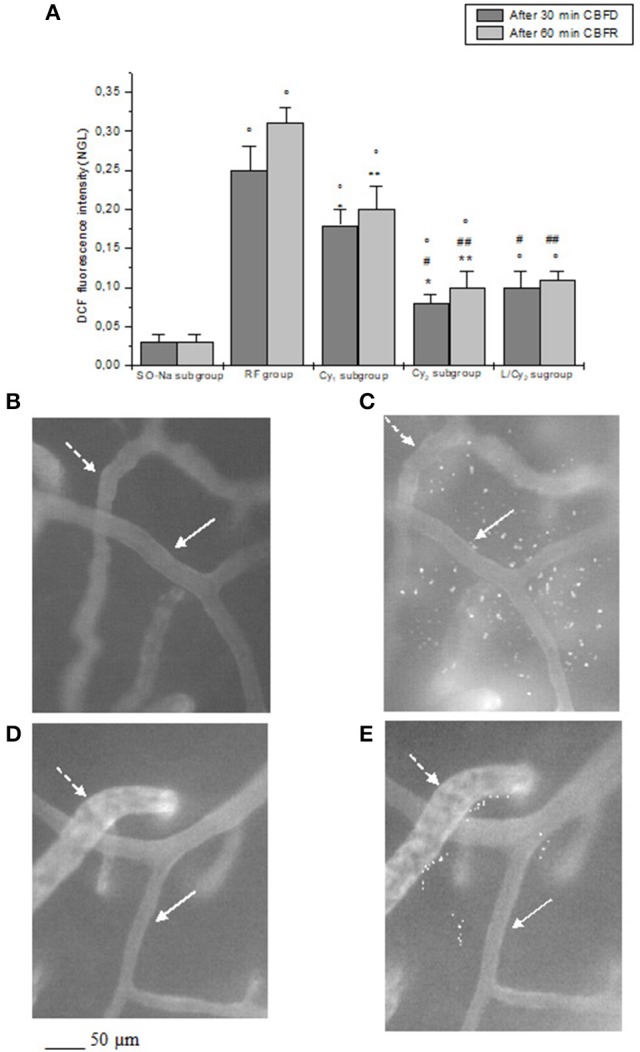
DCF fluorescence intensity after 30 min cerebral blood flow reduction (CBFD) and after 60 min cerebral blood flow recovery (CBFR) in the experimental groups (A): SO-Na subgroup (SO-Na), reduced blood flow group (RF), lower dosage cyanidin-treated subgroup (Cy1), higher dosage cyanidin-treated subgroup (Cy2) and higher dosage cyanidin plus L-NIO-treated subgroup (L/Cy2). Data are reported as Mean ± SEM. °p < 0.01 vs. SO-Na subgroup; *p < 0.01 vs. RF group after 30 min CBFD; **p < 0.01 vs. RF group after 60 min CBFR; +p < 0.01 vs. Cy2 subgroup after 30 min CBFD; ++p < 0.01 vs. Cy2 subgroup after 60 min CBFR; #p < 0.01 vs. Cy1 subgroup after 30 min CBFD; ##p < 0.01 vs. Cy1 subgroup after 60 min CBFR. Computer-assisted images of the pial microvascular network under baseline conditions (B) and after cerebral blood flow decrease and recovery (C) in a rat of RF group: several fluorescent spots are outlined by the marked change in the color of interstitium (from black to white). Computer-assisted images of the pial microvascular network under baseline conditions (D) and after cerebral blood flow decrease and recovery (E) in a higher dosage cyanidin-treated animal: decreased number of fluorescent spots are detected. The arterioles are indicated by the white arrows, while the venules are outlined by dashed white arrows.
