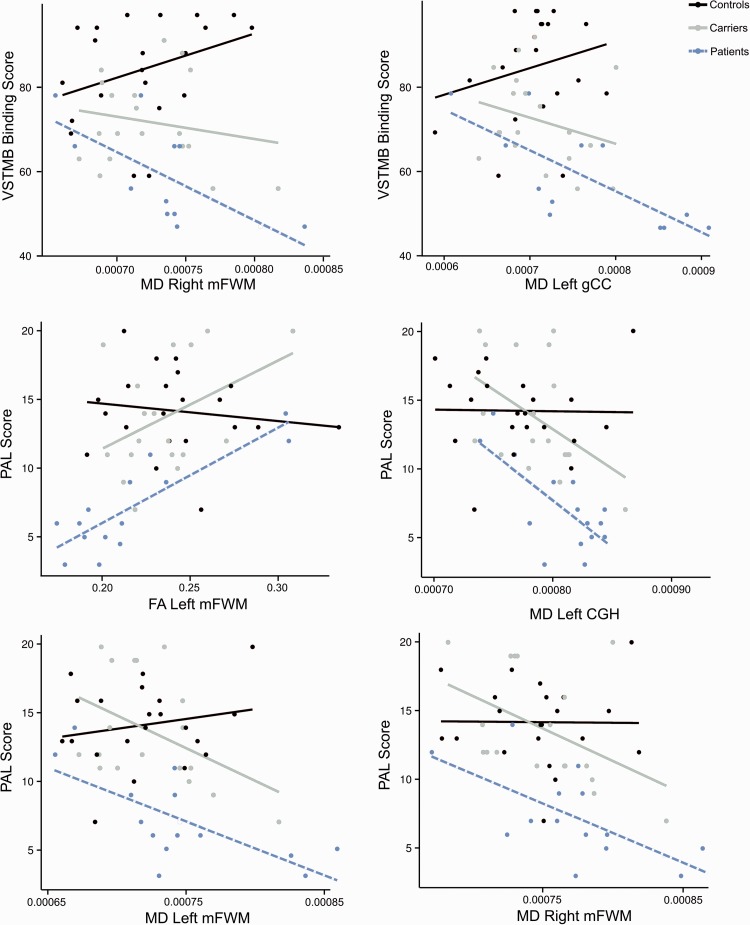
Figure 3.
Regressions with region of interest, memory binding and group. Fitted regression lines for the shape-colour binding (top) and the PAL Task (middle and bottom) and DT-MRI variables for each group separately in the regions where significant correlations between DT-MRI metrics and memory performance were found. Dots show the observed data in raw values and lines represent fitted regression lines. CGH = hippocampal part of cingulum bundle; FA = fractional anisotropy; mFWM = middle FWM; MD = mean diffusivity; gCC = genu CC.

