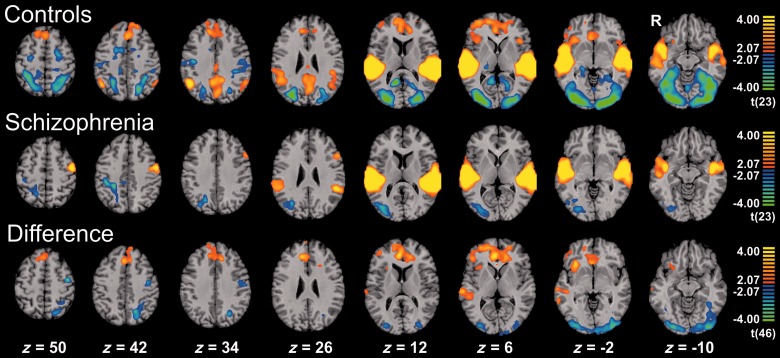
Figure 2.
Hemodynamic response to mismatch blocks. Activation clusters of healthy controls (n = 24; first row), schizophrenia patients (n = 24; second row) and healthy controls > schizophrenia patients (third row) for the contrast mismatch > standard (baseline) condition. Both groups exhibited prominent auditory activations, which differed at the right auditory cortex. Prefrontal and salience network responses were only observed in the control group yielding a significant group difference. The deactivation in the visual system was significantly stronger in the controls. For each contrast, the threshold was set to P < 0.05 and a corrected cluster size threshold based on a Monte-Carlo simulation was applied. z-coordinates refer to the Talairach system.

