
Fig. 3.
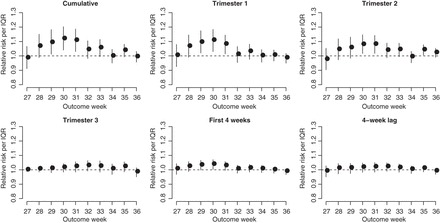
Posterior means and 95% PIs of the RRs for PTB per IQR increase in different metrics of exposure to PM . The IQR for the exposures are given in Table 3.
Official websites use .gov
A
.gov website belongs to an official
government organization in the United States.
Secure .gov websites use HTTPS
A lock (
) or https:// means you've safely
connected to the .gov website. Share sensitive
information only on official, secure websites.
Posterior means and 95% PIs of the RRs for PTB per IQR increase in different metrics of exposure to PM. The IQR for the exposures are given in Table 3.