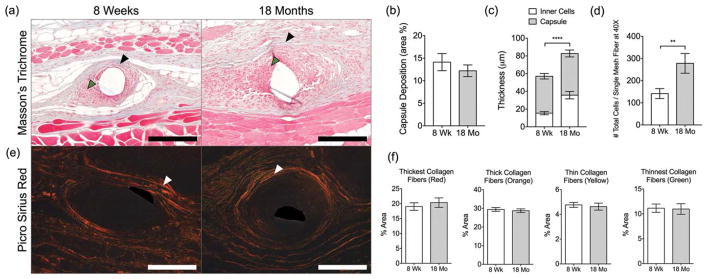
FIGURE 6.
(a) Masson’s Trichrome-stained tissue sections of 8-week-old and 18-month-old mice at 90 days. Black and green arrowheads indicate the collagenous portion of the capsule and cellular reaction surrounding single mesh fibers, respectively. Scale bars represent 200 μm. (b) Image analysis of capsule deposition as percentage from the area of inflammatory tissue (excluding skin and muscle). (c) Thickness of capsule, inner cells, and total thickness. (d) Total number of cells surrounding single mesh fibers. (e) Picro Sirius Red-stained tissue sections of 8-week-old and 18-month-old mice at 90 days. White arrowheads indicate the capsule surrounding single mesh fibers. (f) Image analysis of collagen capsule composition surrounding single mesh fibers of samples stained with Picro Sirius Red. Scale bars represent 100 μm. Bars represent the mean ± SEM. Statistical significance as (**) p < 0.01 and (****) p < 0.0001. All other differences are nonsignificant. N = 7.

