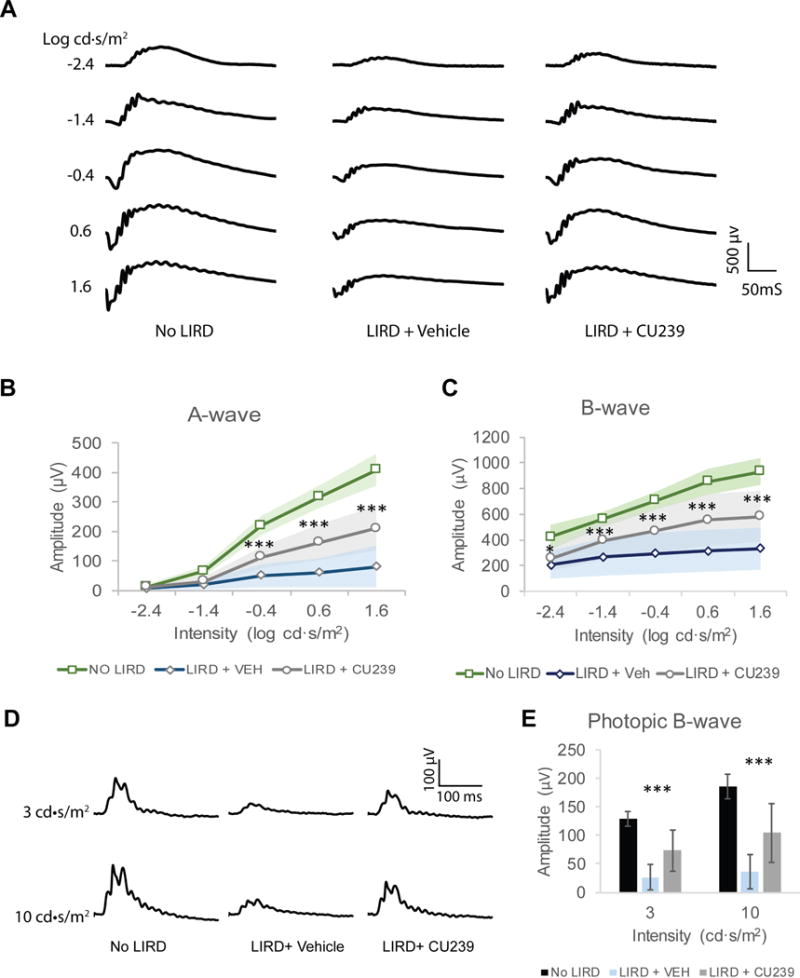
Fig. 7. ERG responses of CU239 injected mice 5 days post-LIRD.

(A) Representative scotopic ERG waveforms from mouse groups No LIRD control, LIRD + Vehicle and LIRD + CU239. Five different stimulus intensities were used, ranging from −2.4 to 1.6 log cd·s/m2. (B) Comparison of the averaged A-wave amplitude from the three groups. Student’s t-test was used (n=8, ***P<0.001, mean ± SEM). (C) Comparison of the averaged B-wave amplitude from the three groups. Student’s t-test (n=8, *P<0.05 and ***<0.001; mean ± SEM). (D) Representative photopic ERG waveforms from groups No LIRD control, LIRD + Vehicle or LIRD + CU239. (E) Comparison of the averaged photopic B-wave amplitude from the three groups (n=8, mean ± SEM).
