
Fig 7. Scaling of the polyQ domain as a function of polyQ length and representative snapshots for all Httex1 constructs studied.
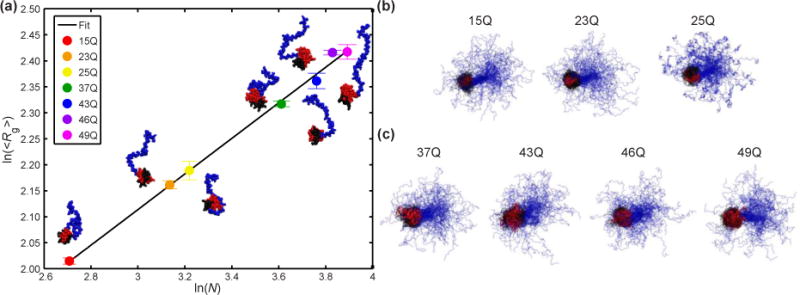
(a) Scaling of the mean size (<Rg>) of the polyQ domain as a function of polyQ length, N. The line corresponds to the best fit to the equation ln(<Rg>)=vln(N)+ln(R0) Here, v=0.34 and R0=2.97 Å. Error bars correspond to the standard error of the mean calculated over five independent simulations. (b) 100 representative snapshots for Httex1 ensembles with wild type polyQ lengths (15, 23, and 25). (c) 100 representative snapshots for Httex1 ensembles with pathogenic polyQ lengths (37, 43, 46, and 49). The N-terminal region is shown in black, the polyQ domain in red, and the C-terminal region in blue. All snapshots are aligned over the polyQ domain and the first 11 residues of the C-terminal region.