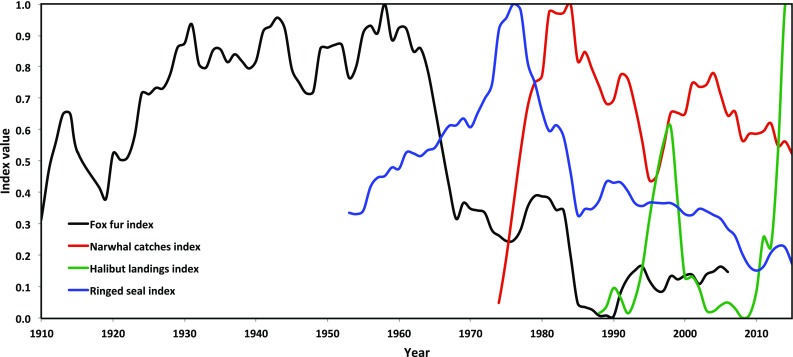
Fig. 2.

Development of catches of four cash generating game species utilised in the Thule Region from 1910 to 2015. Data for foxes and narwhals represent actual catches of individuals, whereas data on seals and halibut represent trade in seal skins and landings of halibuts, respectively. The data area scaled to proportions of the largest catch in the time series. The trends are shown as four-year gliding averages except for halibut where the few data only allowed for 2 year averages. Original data are from Statistics Greenland, Piniarneq and the Greenland Institute of Natural Resources
