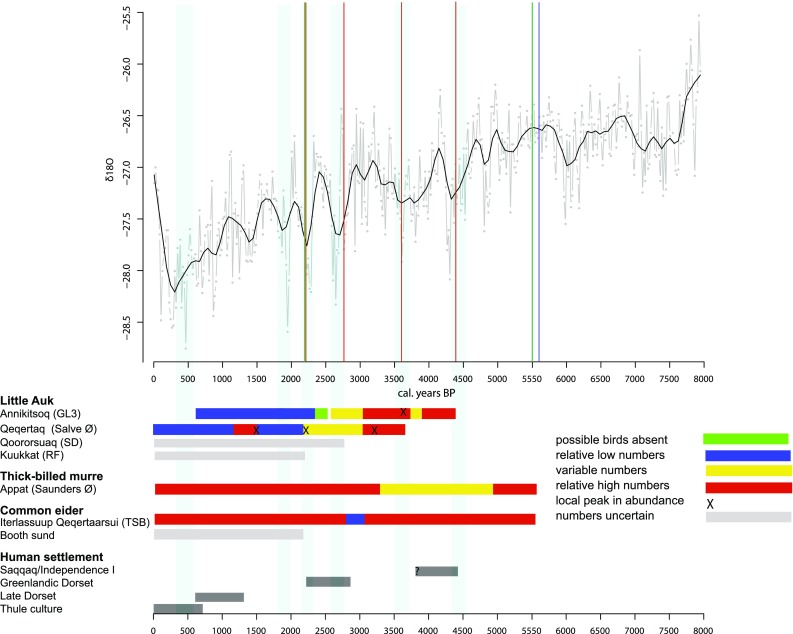
Fig. 4.

Ice core δ18O from Aggasiz which reflects temperature change over the last 8000 years. The vertical lines indicate the arrival points of the various bird colonies. Red for little auk, blue is the thick-billed murre, and green the eider. The pale blue vertical bands mark periods of colder air temperature as inferred form the ice core isotope record. Below there is summarised information on the inferred variation in bird numbers at the sampled colonies and the history of human habitation of the NOW area derived from archaeological records
