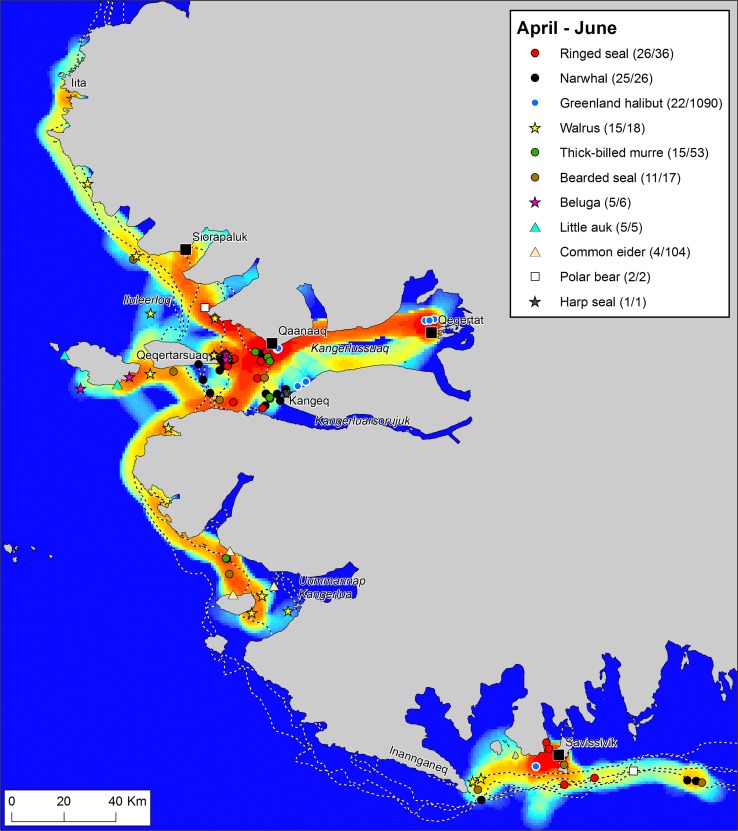
Fig. 2.
Traffic intensity and catches during the months April–June 2015/16, recorded by hunters that participated in the Piniariarneq study. Traffic intensity (km track line per km2) is displayed on a relative scale for the season, ranging from blue (low) over yellow (intermediate) to red (high). In the legend, the number of recorded catch events and the estimated number of individuals bagged are given for each species. Place names mentioned in the main text are indicated on the map. The dotted white-and-black lines represent the extent of the land-fast ice during the first week of the months April–June 2015/16. This was clearly a period dominated by the hunting of a wide range of species along the edge of the land-fast sea ice

