
Fig. 3.
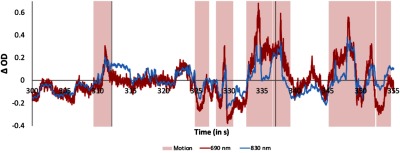
Motion artifacts. Example motion artifacts (highlighted in pink) present during a segment of the time series for one channel for one participant. The red line shows the 690-nm wavelength, whereas the 830-nm wavelength is shown in blue. Vertical lines depict the onset of a trial (i.e., timepoint 0). The figure shows the raw time series, before any motion correction is applied and before bandpass filtering.