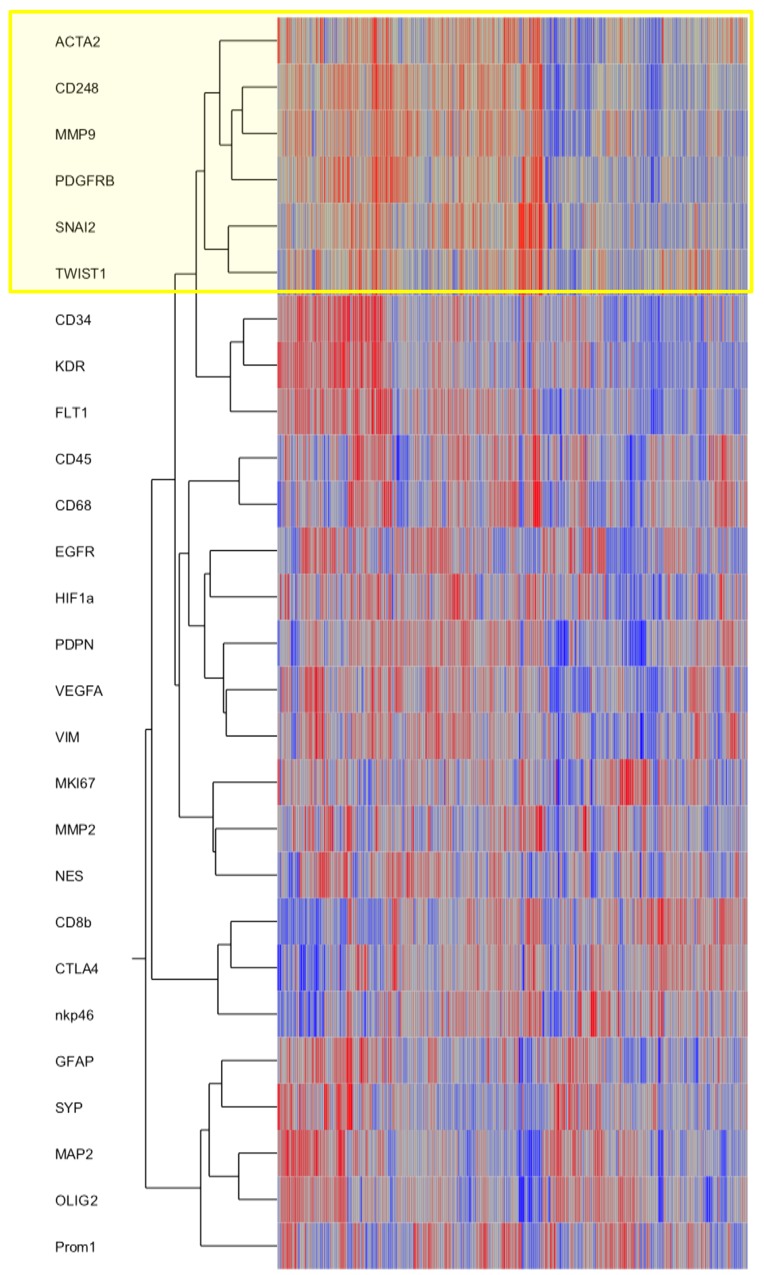
Figure 5. SNAI2 and TWIST mRNA expression clusters with VAMCs/pericytic markers.
Hierarchical cluster analyses of gene expression signatures of selected key factors of EMT, glioblastoma cells as well as glioblastoma micromilieu of 424 primary glioblastomas and 11 normal brain samples deriving from the TCGA data portal using the Agilent 244K G4502A microarray to determine mRNA profiles. Compared marker profiles: ACTA2, CD248, PDGFRB (pericytes/ VAMCs), CD34, KDR, FLT1 (endothelial cells), CD45 (leukocytes), CD68 (microglia/macrophages), lCD8b, CTLA4, nkp46 (lymphocytes), GFAP, MAP2, OLIG2, PROM1, NES, EGFR, VIM (distinct differentiation of glioma cells), SYP (neurons), HIF1a, VEGFA (hypoxia, angiogenesis) or MMP2, MMP9 (migration). Hierarchical clustering of this data was performed using the Ward’s minimum variance method.

