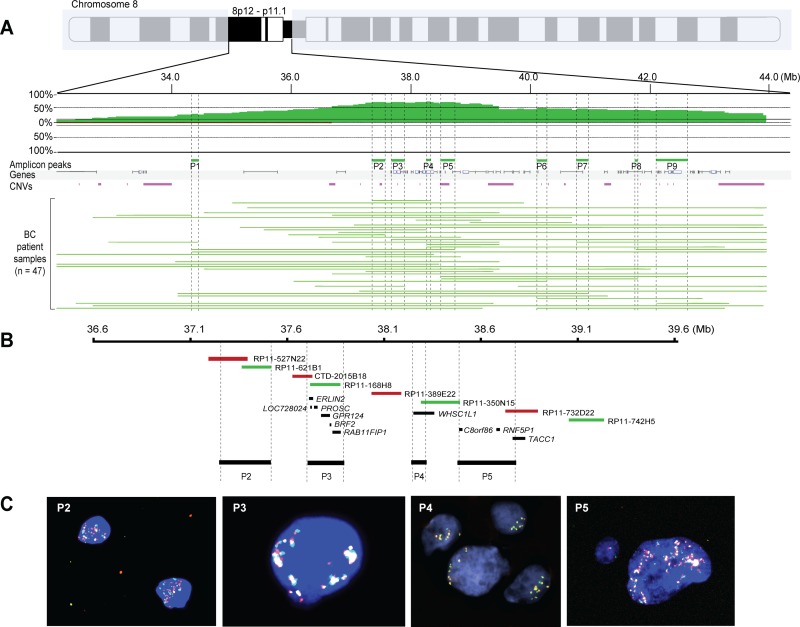
Figure 2. Nine common 8p11-p12 amplification peaks identified despite breast tumor heterogeneity.
(A) Frequency plot of 8p11-p12 amplification in 47 breast tumors. The x-axis depicts the genomic position on chromosome 8 in Mb according to UCSC May 2004 hg17: NCBI Build 35 from the telomere on the 8p arm to the centromere; y-axis, percentage of tumors with amplification (green) and loss (red). Vertical dashed lines indicate the nine most common amplification peaks (P1-P9). Horizontal green lines indicate the DNA amplification regions for each tumor sample. (B–C) Zoom-in of peaks P2–P5 showing BAC clones used in locus-specific dual-color FISH and significantly associated genes spanning each peak. Biotin-labeled (green) BAC clones RP11-621B1 (P2), RP11168H8 (P3), RP11-350N15 (P4), RP11-742H5 (P5) were combined with digoxigenin-labeled (red) BAC clones RP11-527N22 (P2), CTD-2015B18 (P3), RP11-389E22 (P4), RP11-732D22 (P5). Overlapping DNA sequences were detected as yellow hybridization signals. The interphase nuclei were counterstained with DAPI.

