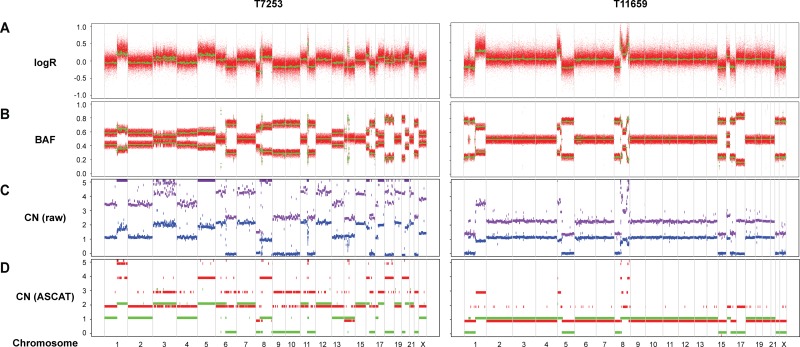
Figure 3. Allele-specific copy number analysis reveals elevated DNA copy number for the 8p11-p12 genomic region on one of the alleles.
SNP genotyping copy number profiles for samples T7253 and T11659, showing (A) logR and (B) B allele frequency (BAF) plots. Green lines indicate genomic segments of constant logR and BAF values, as identified using the ASCAT (allele-specific copy number analysis of tumors) algorithm. (C) Raw ASCAT profile containing allele-specific copy number for all loci. The x-axis depicts the genomic location and the DNA copy number on the y-axis. Purple and blue indicate the copy number of the minor allele and the estimated overall copy number, respectively. (D) ASCAT profile containing probes that are heterozygous in the germline. The x-axis depicts the genomic location and the DNA copy number on the y-axis. Green and red indicate the copy number of the minor allele and the estimated overall copy number, respectively.

