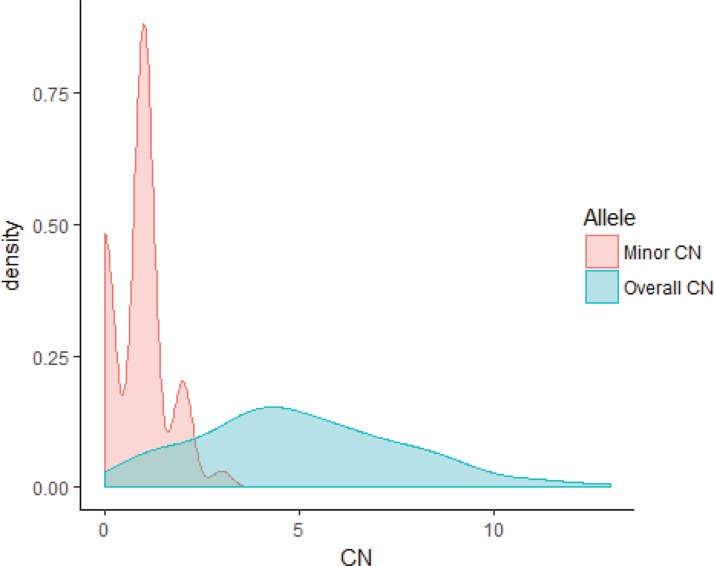
Figure 4. Distribution of the minor and overall copy number in the 23 samples.
Density plot for the minor and overall copy number spanning the 8p11-p12 genomic region (31.9–43.9 Mb). The overall copy number ranged from 1 to 13, whereas the minor allele displayed comparatively low copy number (range 0–3). The x-axis depicts the copy number; y-axis, density.

