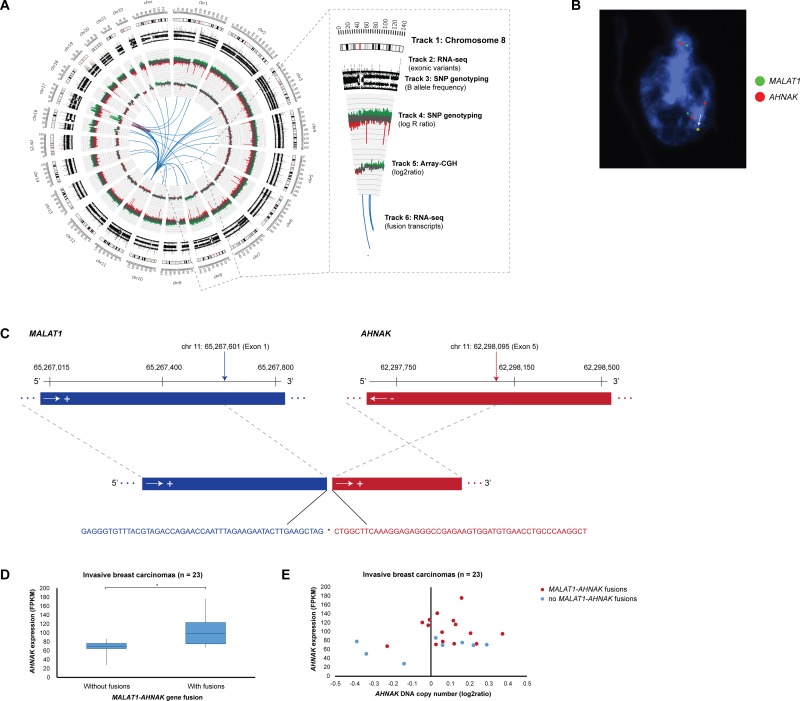
Figure 5. Elevated AHNAK expression levels in samples harboring MALAT1-AHNAK gene fusions.
(A) Circos plot depicting genome-wide SNP genotyping, array-CGH, and RNA-seq data in breast carcinoma sample T11378. Track 1: Chromosome cytobands from pter to qter. The centromere is shown as a red bar. Track 2: Mutations in exonic regions (exonic variants) identified with RNA-seq data are shown as dark gray bars. Track 3: B allele frequency of SNP genotyping data. Track 4: Log R ratio of SNP genotyping data, where copy number gains and losses are depicted in green and red, respectively. Track 5: Array-CGH data, where copy number gains and losses are depicted in green and red, respectively. Track 6: Gene fusions identified with RNA-seq data. Intrachromosomal and interchromosomal gene fusions are shown in red and blue lines, respectively. (B) Locus-specific dual-color FISH with biotin-labeled (green) BAC clones RP11-642F7, RP11-1104L6, RP11-472D15 for MALAT1 were combined with digoxigenin-labeled (red) BAC clones CTD-2240J20 for AHNAK. Overlapping DNA sequences were detected as yellow hybridization signals (see arrow). The interphase nuclei were counterstained with DAPI. (C) Overview of the exon structure, breakpoint location, and nucleotide sequence for the MALAT1- AHNAK fusion transcript (5′ and 3′ fusion gene partners are depicted in blue and red, respectively) in sample T11378. The breakpoint sequence positions for each of the fusion gene partners are indicated by vertical arrows and the DNA strand orientation by horizontal arrows. The exon structure and nucleotide sequence at the fusion transcript breakpoint (indicated by asterisk) is indicated by dotted gray lines. Sequence positions are based on alignment with hg19 from the UCSC Genome Browser. (D) Breast carcinomas containing MALAT1-AHNAK gene fusions have elevated AHNAK expression levels (P = 0.0031). Statistically significant differences (P < 0.05) in AHNAK expression levels between tumors with and without MALAT1-AHNAK gene fusions are indicated by an asterisk (*). (E) Breast carcinomas containing MALAT1-AHNAK gene fusions (dark red dots) have elevated AHNAK expression levels compared to tumors without gene fusions (blue dots).

