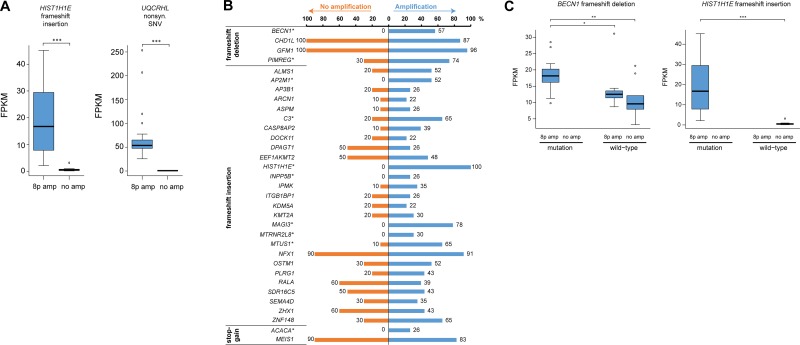
Figure 6. Few exonic variants are associated with 8p11-p12 amplification.
(A) Box plots illustrating mutation-dependent changes in FPKM values for two genetic variants found in all 23 samples with 8p11-p12 amplification (denoted 8p amp) and none of the TCGA breast carcinoma samples with neutral 8p11-p12 copy number (denoted no amp). (B) Bar plot illustrating the percentage of 8p11-p12 amplified samples (blue bars) and TCGA breast carcinoma samples with neutral 8p11-p12 copy number (orange bars) harboring a putative deleterious genetic variant in exonic regions (in at least 20% of amplified samples). Genetic variants with significantly different mutation frequencies in the two groups were marked with an asterisk (*) symbol (P < 0.05). (C) Box plots illustrating the effect of 8p11-p12 amplification and mutation status on FPKM values. Asterisk denotes significant p-values (*P < 0.05, **P < 0.01, ***P < 0.001).

