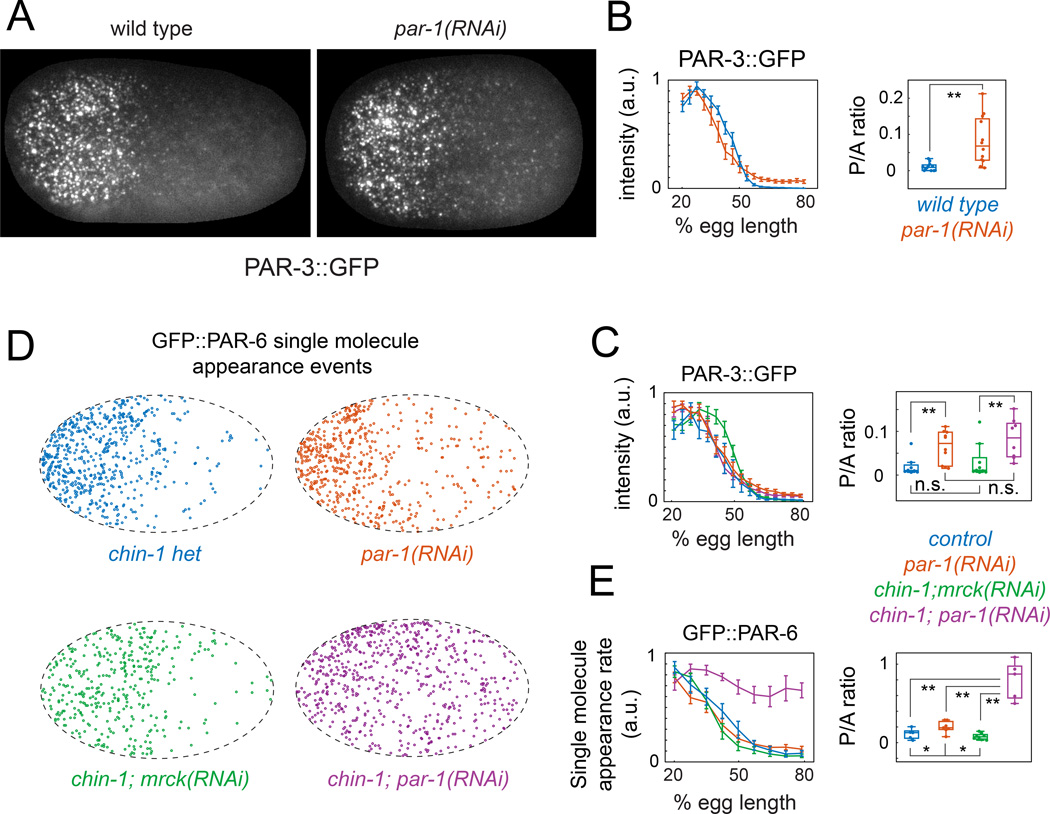
Figure 4. PAR-3 acts locally to gate cortical association of PAR-6/PKC-3 with active CDC-42.
(A) Surface views of cortical PAR-3::GFP at early maintenance in wild-type and par-1(RNAi) embryos. (B) PAR-3::GFP intensity vs. AP position measured during early maintenance phase in wild type (n = 12) and par-1(RNAi) (n = 12) embryos. (C) PAR-3::GFP intensity vs. AP position during early maintenance in wild type (n = 8), chin-1(tm1909);mrck- 1(RNAi) (n = 10), par-1(RNAi) (n = 8) and chin-1(tm1909);par-1(RNAi) (n = 8) embryos. (D) Spatial distributions of single molecule appearance events for GFP::PAR-6 during early maintenance in embryos with the indicated genotypes (E) Plots of single molecule appearance rates vs. AP position in wild-type (n = 6), chin-1(tm1909);mrck-1(RNAi) (n = 6), par-1(RNAi) (n = 6), and chin-1(tm1909);par-1(RNAi) (n = 6) embryos. Error bars in B,C,E indicate +/− 1 SEM. Box and whisker plots in B,C,E show distributions of Posterior::Anterior (P/A) ratios for the data shown in the graphs. *p < 0.05; **p < 0.005 by Students T test. See main text and experimental procedures for details. See also Figure S3 and Movies S5 & S6.

