
Figure 6. SETDB2 Knockdown Increases Sensitivity to Kinase and Epigenetic Inhibitors.
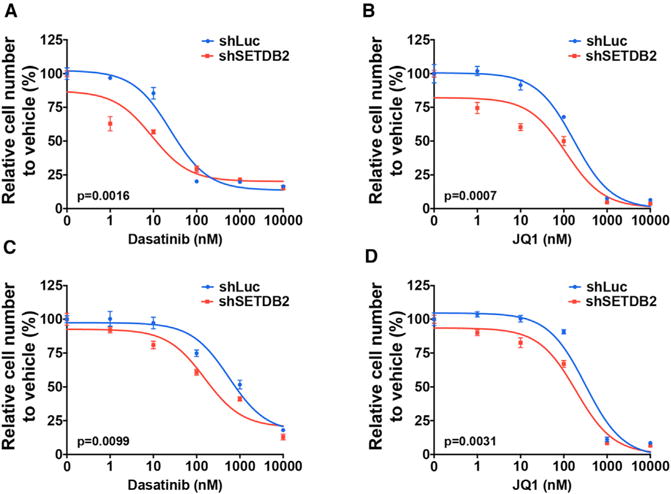
(A and C) Dose-response curves are shown for control or SETDB2 shRNA-treated RCH-ACV (A) and 697 (C) cells cultured in increasing concentrations of dasatinib. IC50 for dasatinib in combination with control or SETDB2 shRNA is 24.84 versus 9.23 nM (for RCH-ACV cells) and 560 versus 154 nM (for 697 cells), respectively.
(B and D) Dose-response curves are shown for control or SETDB2 shRNA-treated RCH-ACV (B) and 697 (D) cells cultured in increasing concentrations of JQ1. IC50 for JQ1 in combination with control or SETDB2 shRNA is 172.6 versus 112.5 nM (for RCH-ACV cells) and 316.4 versus 192.8 nM (for 697 cells), respectively.