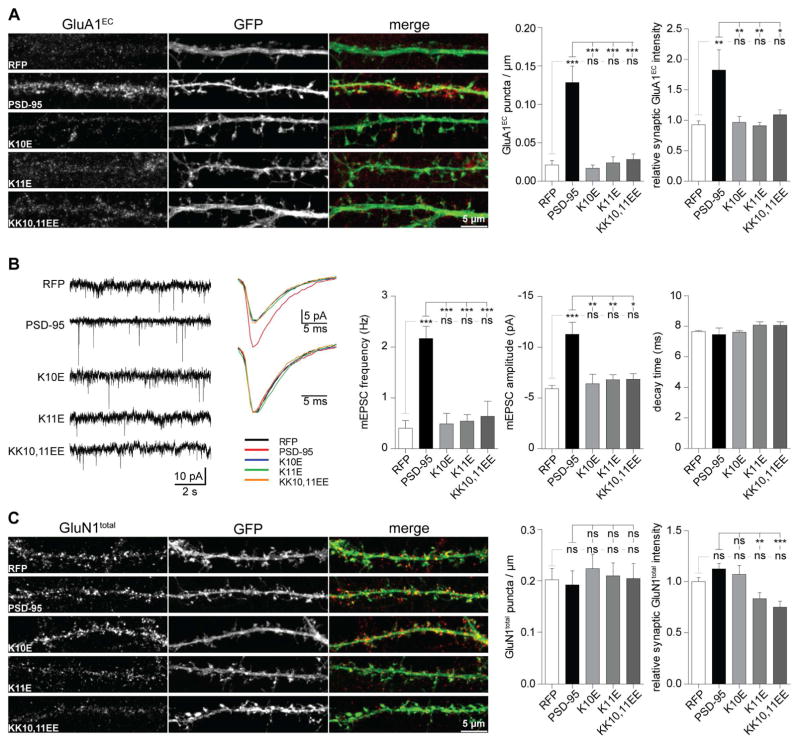
Figure 5. α-actinin binding-deficient PSD-95 fails to promote synaptic enrichment of AMPAR.
Hippocampal cultures were transfected as in Figure 4, fixed and stained at 18 DIV for extracellular GluA1 (GluA1EC; A) or, after permeabilization, total GluN1 (GluN1total; C) or used for mEPSC recordings at 11–14 DIV (B). Mean IF intensities (right bar diagrams) were quantified as above.
(A) All three PSD-95 mutations abrogated the increase in GluA1EC puncta density and intensity induced by ectopic PSD-95WT expression (n > 12 images from > 6 cells from 3 independent experiments).
(B) Mini EPSC sample traces (left) and averaged individual events from a single cell (right) to scale (top) and normalized to peak (bottom). All three PSD-95 mutations abrogated the increase in frequency and amplitude induced by ectopic PSD-95WT expression. The average mEPSC decay time was unchanged (n = 5–9 cells per condition).
(C) GluN1total puncta density was unaltered by PSD-95WT or any of the PSD-95 mutants vs RFP. GluN1total synaptic IF intensity was unaltered by PSD-95WT and PSD-95K10E vs RFP but decreased without reaching statistical significance by PSD-95K11E and PSD-95KK10,11EE vs PSD-95WT (n > 28 images of > 14 cells from 3 independent experiments).
Statistical significance was tested by 1-way ANOVA with Bonferroni’s Multiple Comparison Test.

