Figure 3.

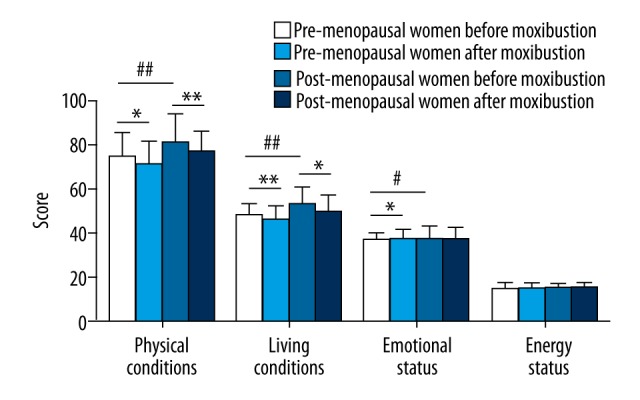
Comparison of the scores between the pre-menopausal women and post-menopausal women in the mox group (mean ±SD). *, # P<0.05; ** ## P<0.01.

Comparison of the scores between the pre-menopausal women and post-menopausal women in the mox group (mean ±SD). *, # P<0.05; ** ## P<0.01.