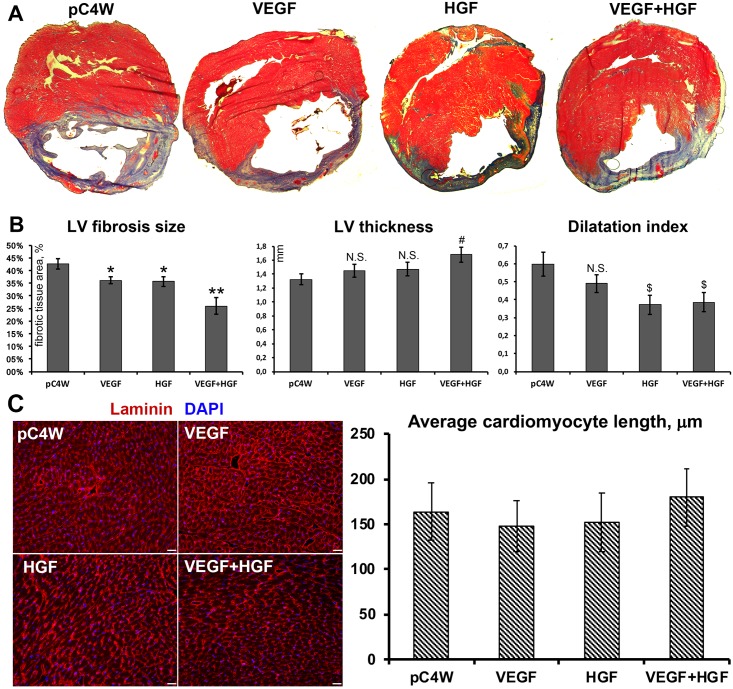
Fig 2. Morphometry of LV sections obtained from study groups.
A—Representative images of stained sections of myocardium obtained at day 14 of experiment (fibrotic depositions stain blue); B—Results of morphometry in experimental groups treated by VEGF165, HGF or combined gene delivery; Student’s t-test (n = 4-5/group, presented as Mean±S.E.M.). LV fibrosis size graph: *p<0.05 vs “pC4W” negative control; **p<0.05 vs. “pC4W” negative control and vs. “VEGF” or “HGF” group. LV thickness graph: N.S.–not significant vs. “pC4W”; # p<0.05 vs. “pC4W”. Dilatation index graph: N.S.–not significant vs. “pC4W”; $ p<0.05 vs. “pC4W”. C—Representative images of myocardium cross-section stained for laminin (left panel) and results of cardiomyocyte length analysis in respective study groups (right graph). No significant intergroup variability was found (p>0.05).

