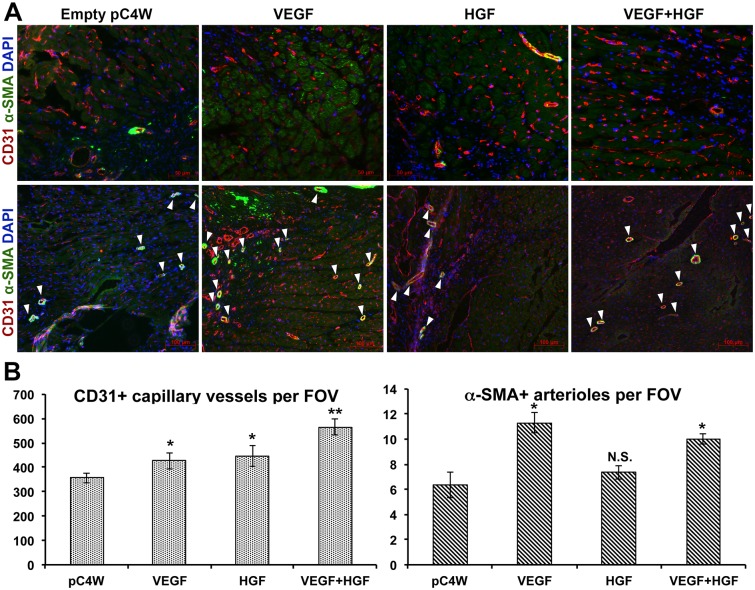
Fig 5. Evaluation of angio- and arteriogenesis after gene delivery of VEGF165 and HGF.
A—Representative images of peri-infacrt area in cross section of myocardium after immunofluorescent visualization of CD31 and α-SMA (upper row of images in ×200 magnification emphasizes capillary morphology, lower row in ×100 magnification shows representative examples of arteriole-sized vessels); B—Results of vascular density analysis in groups treated by VEGF165, HGF or combined gene delivery (data presented as Mean±S.E.M.). Mann-Whitney U-test (n = 4-5/group): *p<0.05 vs. “pC4W” negative control; **p<0.01 vs. “pC4W”, “HGF” or “VEGF+HGF” groups; N.S.–non-significant (p>0.05 vs. “pC4W” negative control).

