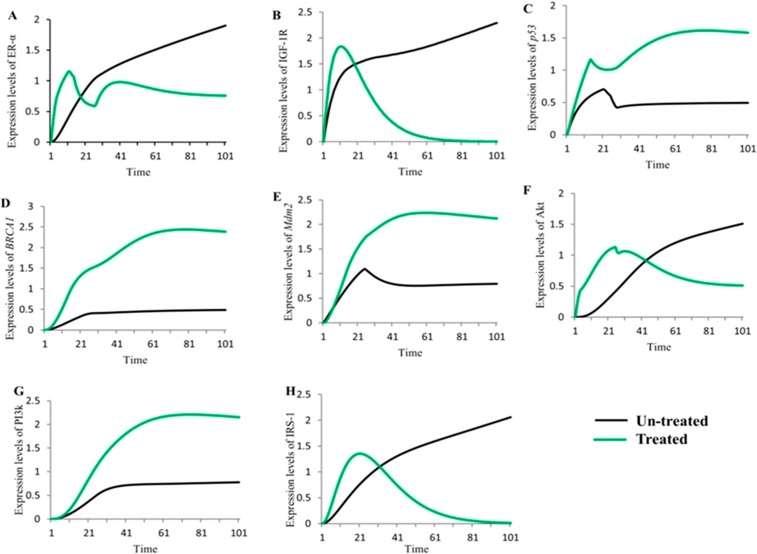
Fig 10. Comparison of simulated graphs of both un-treated and treated IGF-1R associated HPN models.
The simulation graph represents the relative expression level (x-axis) of key entities with respect to time (y-axis). The black sigmoid curves represent the un-treated behaviours and green curves represent the treated behaviours of entities involved in IGF-1R associated signaling. Fig 10A–10H represents the relative change in dynamical behaviours of key proteins (ER-α, IGF-1R, p53, BRCA1, Mdm2, Akt, PI3k and IRS-1) before and after treated with anti-estrogen to be occurred.

