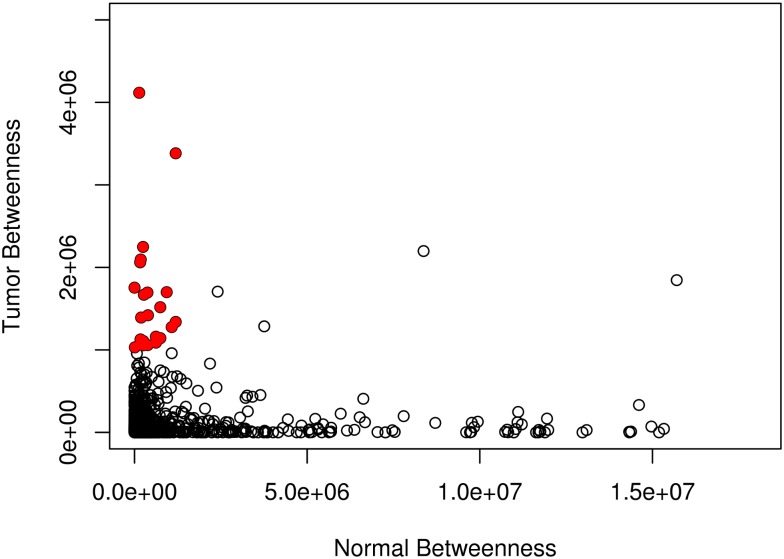
Fig 3. Comparison of betweenness measures in the normal and tumor networks.
Filled (red) circles indicate genes whose betweenness measure is at least 1.1 times as large in the tumor network as in the normal network and either a tumor betweenness or normal betweenness value greater than 1e6. These genes are listed in Table 1, and shown in pink in Fig 4.

