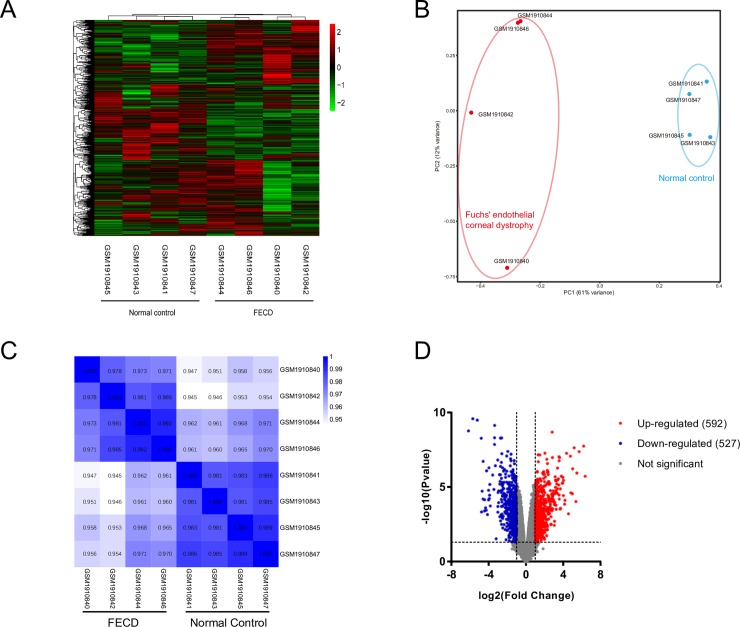
Fig 1. The summary of the dataset GSE74123.
(A) The cluster heatmap of GSE74123. (B) The PCA of GSE74123 showed that significant differences between the two groups of samples. (C) Pearson heatmap showed the correlation between the two groups of samples. There was a high correlation within each group of samples. (D) The volcano plot showed the distribution of all genes by fold change and P value. The expression of FECD group was compared with control group. Genes with |log2 (fold change) | > 1 and P value < 0.05 were selected as the DEGs.

