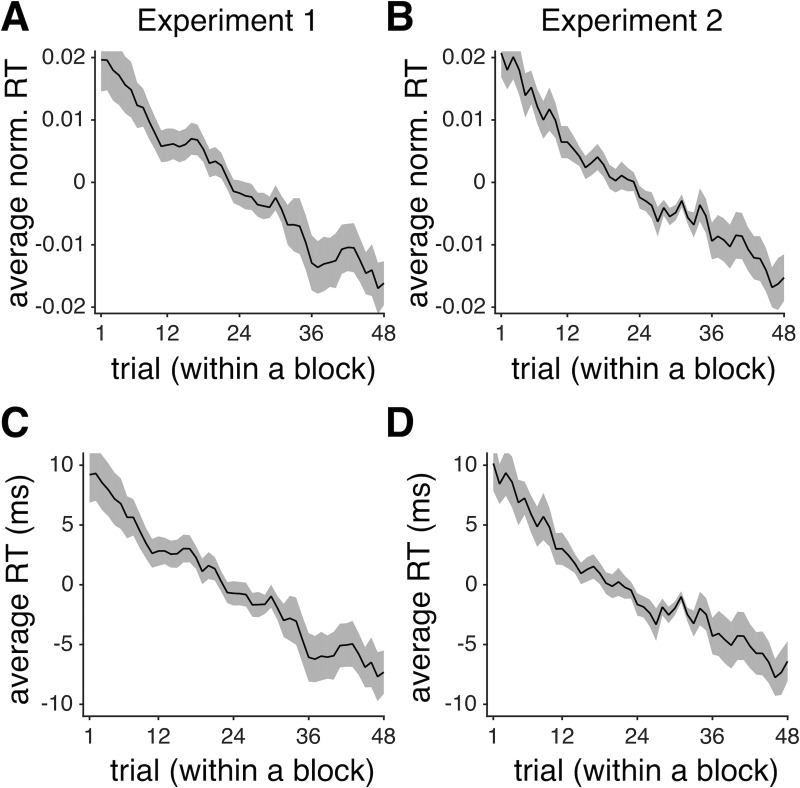
Fig 3. Subjects made decisions more quickly as they progressed through the trials within each block of Experiments 1 and 2.
Plotted is the average z-scored RT (across all subjects) as a function of the trial number within a session of Experiment 1 (A) and Experiment 2 (B). Shaded areas indicate s.e.m. (C-D) The same as in (A-B) but showing the average actual RT over all subjects after removing the median RT from each individuals’ RT distribution.

