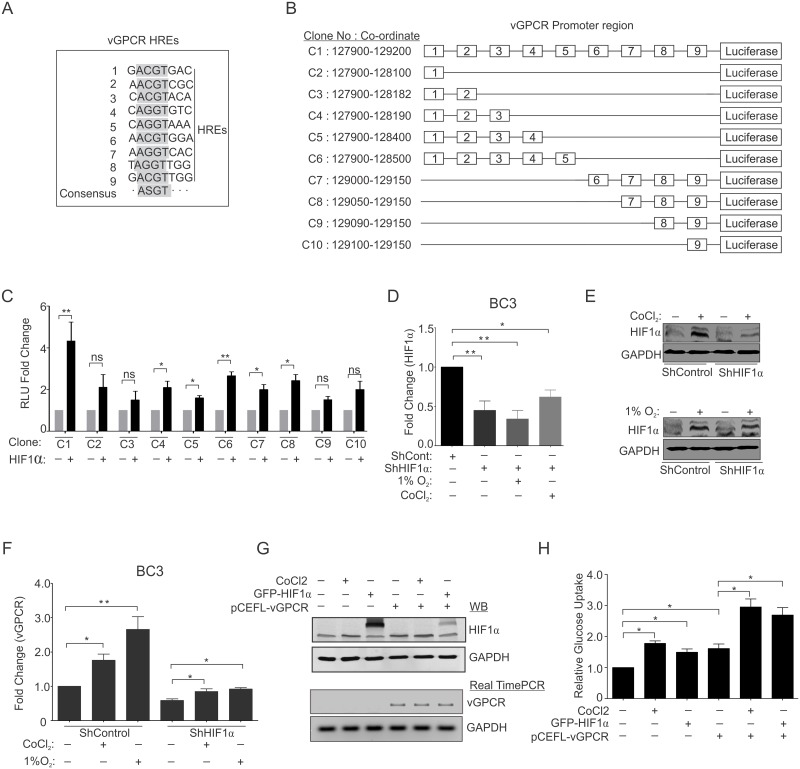
Fig 3. Role of HIF1α-vGPCR axis in metabolic changes of KSHV infected cells.
(A) Representation of various HREs in the promoter region of vGPCR. vGPCR promoter region was scanned for presence of HREs with the consensus sequence (–ASGT---; where S = C/G;[16]). (B) Schematic representation of various clones of vGPCR promoter used for luciferase based reporter assay. (C) Relative luminescence unit of various promoters constructs in the absence/presence of over-expressed HIF1α. HEK293T cells were transfected with either promoter clone alone or co-transfected with HIF1α plasmid. The cells were lysed in passive lysis buffer and equal amounts of proteins were used for luciferase based assays. (D) Fold change expression of HIF1α in ShControl and ShHIF1α BC3 cells grown under normoxia or CoCl2/1%O2 induced hypoxia. BC3-ShControl and BC3-ShHIF1α were generated by lentiviral based transduction and selected under 2μg/ml puromycin. Cells were grown under normoxia or CoCl2/1%O2 induced hypoxia followed by RNA isolation, cDNA synthesis and HIF1α real time PCR. (E) Western Blot analysis for HIF1α in ShControl and ShHIF1α BC3 cells grown under normoxia or CoCl2/1%O2 induced hypoxia. Equal amount of whole cell lysates were used to probe for HIF1α. (F) Relative fold change expression of vGPCR transcripts in ShControl and ShHIF1α BC3 cells grown under normoxia or CoCl2/1%O2 induced hypoxia. (G) Western blot analysis of HIF1α and Real time PCR for vGPCR transcripts. (H) Relative glucose uptake in HIF1α/vGPCR over-expressed cells. HEK293T cells were transfected with HIF1α or vGPCR plasmids alone or in combination and the results of glucose uptake were compared with control cells or cells treated with CoCl2. The mean values from individual experiments were used to plot graph and the error bars were calculated based on differences from mean value (* p≤0.05, **≤0.01).

