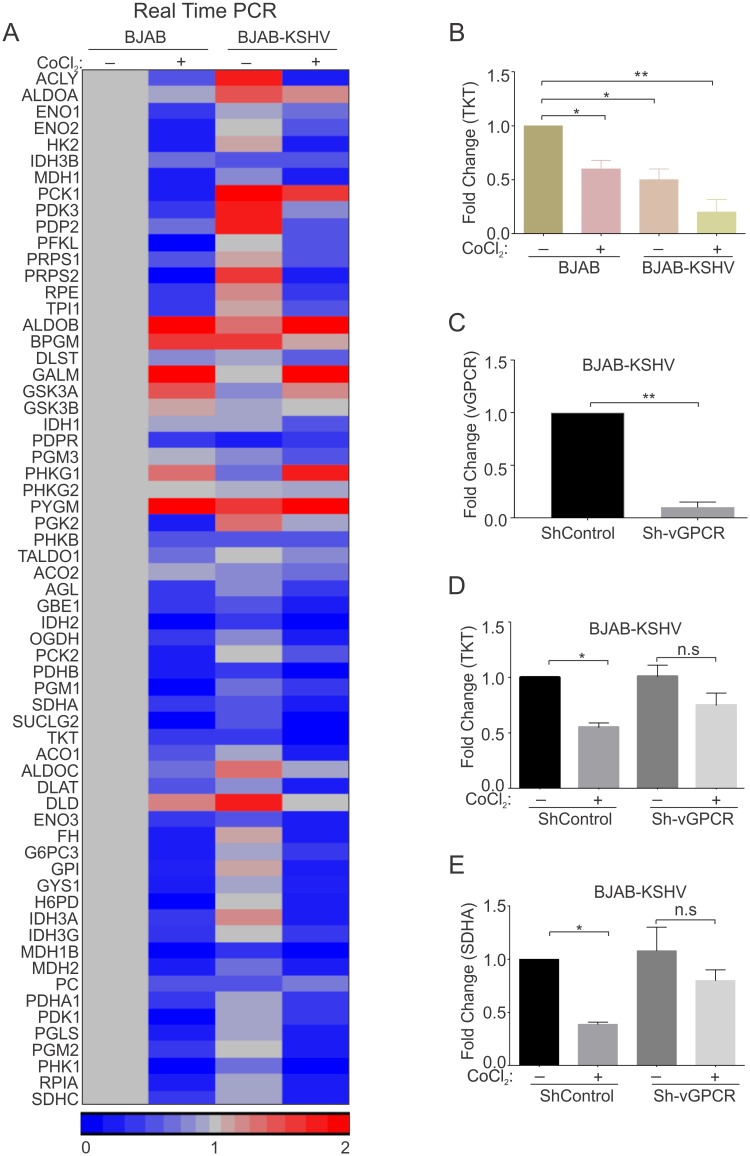
Fig 8.
(A) Intensity map for the Real-time PCR fold change of differentially expressed genes in BJAB-CoCl2/BJAB-KSHV/BJAB-KSHV-CoCl2 cells compared to BJAB cells. A set of genes belonging to metabolic pathways were chosen to be validated by real time PCR. The difference in fold change of BJAB-CoCl2/BJAB-KSHV/BJAB-KSHV-CoCl2 cells when compared to BJAB cells were used to generate heat-intensity maps. The real-time PCR experiments were performed in duplicates, with an experimental repeat for each gene. (B) Real time PCR for TKT in BJAB and BJAB-KSHV cells grown in normoxia and CoCl2 induced hypoxia. (C) Real time PCR to determine expression of vGPCR in BJAB-KSHV cells infected with lentiviral based ShControl and Sh-vGPCR. (D) Real time PCR to determine expression of TKT in ShControl and Sh-vGPCR BJAB-KSHV cells grown under normoxic or CoCl2 induced hypoxic environment. (E) Real time PCR to determine expression of SDHA in ShControl and Sh-vGPCR BJAB-KSHV cells grown under normoxic or CoCl2 induced hypoxic environment. All real-time PCR assays were performed at least in triplicates, with experimental repeat for each gene. Asterisk (*) indicates differences which are statistically significant (* p≤0.05, **≤0.01).

