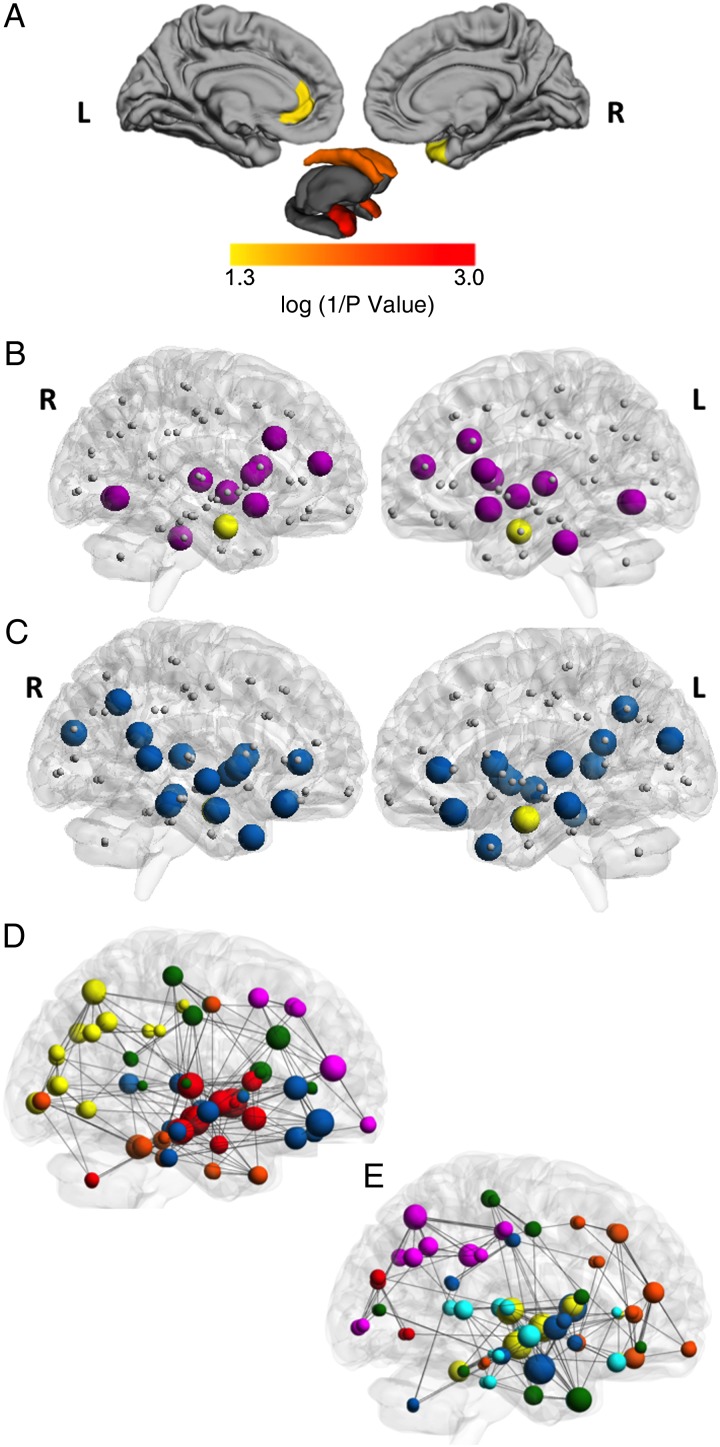
Figure 3.
Regional group differences, hubs and modularity. (A) Regional group differences in degree are displayed in color on the left lateral and medial cortical surfaces (top row), and on a model of subcortical structures (bottom row). Color indicates regions for which the FXS group demonstrated significantly reduced degree relative to the TD group (P < 0.05). There were no regions for which the FXS group demonstrated significantly increased degree. (B) Hubs based on degree for the FXS group and (C) the TD group. Nodes are shown in gray. Group-specific hubs are shown in purple for the FXS group and blue for the TD group. Common hubs are yellow. Nodes and hubs are displayed on lateral transparent surface rendering of right and left hemispheres. (D) Modularity for the fragile X group and (E) the TD group. Each color indicates a unique module within each group. Modules are displayed on transparent surface rendering of the right hemisphere.

