
Fig. 1.
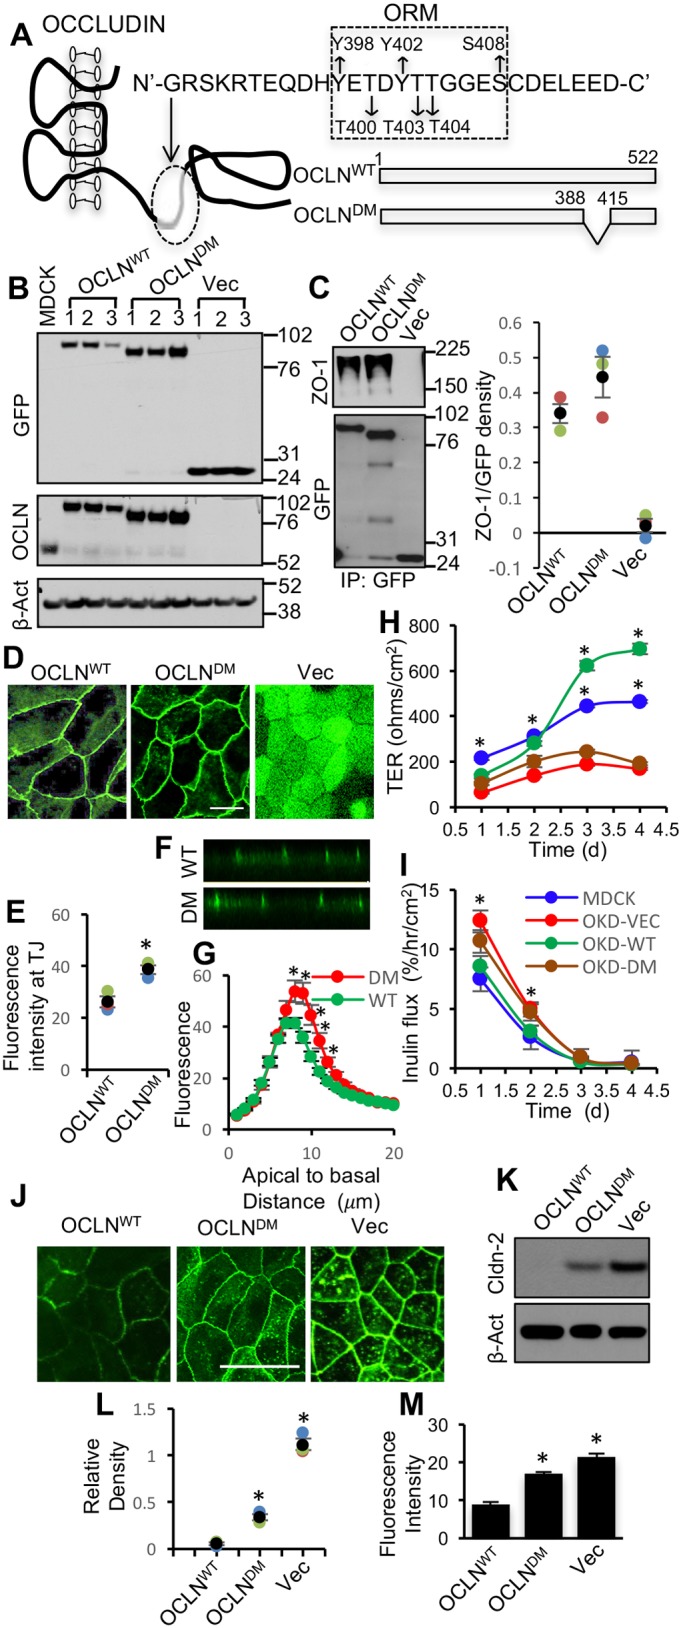
Deletion of ORM enhances occludin association with the TJ. (A) A part of the sequence (G388-D415) in the C-terminal domain of occludin including ORM (Y398-S408) was deleted from the wild-type human occludin (OCLNWT) to generate a deletion mutant of occludin (OCLNDM). (B) Stable clones of OD-MDCK cells expressing EGFP-OCLNWT, EGFP-OCLNDM and EGFP vector (Vec) were generated. Total protein extracts were immunoblotted for EGFP, occludin (OCLN) and β-actin (β-Act). (C) GFP was immunoprecipitated from the native extracts of OCLNWT, OCLNDM and Vec cells and immunoblotted for ZO-1. Density of ZO-1 was measured and normalized to the corresponding EGFP band density. Values presented in the graph are means±s.e.m. (n=3). (D,E) OCLNWT, OCLNDM and Vec cell monolayers were imaged live for EGFP (D). Junctional fluorescence was evaluated by densitometric analysis (E). Values, in arbitrary units of fluorescence intensity, are means±s.e.m. (n=3). Asterisks indicate that values are significantly (P<0.05) different from the OCLNWT value. (F,G) Z-section images of GFP fluorescence in OLCNWT (WT) and OCLNDM (DM) cell monolayers were captured (F), and Z-profiling of GFP fluorescence in these cell monolayers were analyzed (G). Values are means±s.e.m. (n=4). Asterisks indicate that values are significantly (P<0.05) different from corresponding values for WT cell monolayers. (H,I) Equal numbers of MDCK (blue), OCLNWT (OKD-WT; green), OCLNDM (OKD-DM; brown) and Vec (OKD-VEC; red) cells were seeded onto transwell inserts. TER (H) and FITC-inulin flux (I) were measured at various time points post seeding. Values presented in the graph are means±s.e.m. (n=3; three different clones for each group and the value for each clone is the average of six for 1 h, five for 2 h, four for 3 h and three for 4 h). The experiment was performed twice. Asterisks indicate MDCK and OCLNWT values that are significantly (P<0.05) different from corresponding values for Vec and OCLNDM groups. (K,L) Total protein extracts from OCLNWT, OCLNDM and Vec cells were immunoblotted for claudin-2 (Cldn-2) (K). Immunoblot bands were quantified by densitometric analysis (L). Values are means±s.e.m. (n=3). Asterisks indicate that values are significantly (P<0.05) different from the corresponding OCLNWT value. (J,M) Fixed cell monolayers were stained for Cldn-2 by immunofluorescence method (J). Fluorescence at the intercellular junctions was measured by densitometric analysis (M). Values are means±s.e.m. (n=3). Asterisks indicate that values are significantly (P<0.05) different from the corresponding OCLNWT value. Scale bars: 50 μm.