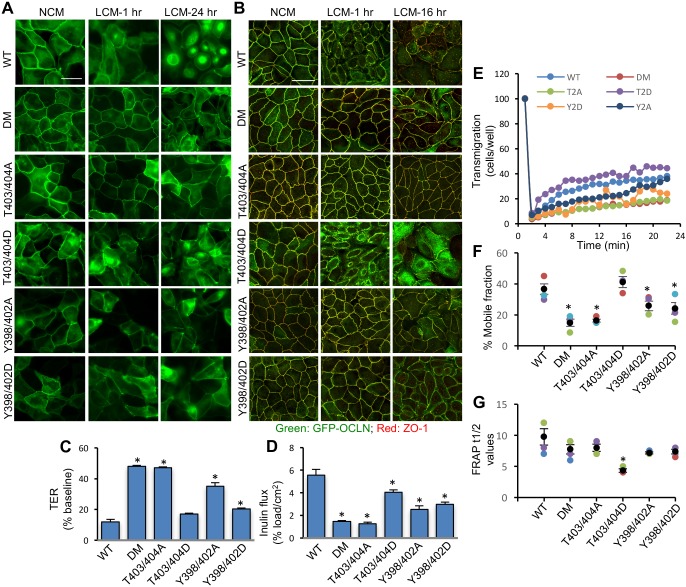
Fig. 5.
Phosphorylation of ORM on T403/T404 and Y398/402 determines the dynamic properties of TJs. (A,B) OCLNWT (WT), OCLNDM (DM), OCLNT403/404A (T403/404A), OCLNT403/404D (T403/404D), OCLNY398/402A (Y398/402A) and OCLNY398/402D (Y398/402D) cell monolayers were incubated with low-Ca2+ medium (LCM) or normal-Ca2+ medium (NCM) for 1–24 h. Live-cell images for EGFP fluorescence were collected before and after incubation (A). Cell monolayers fixed at 1 h and 16 h were stained for EGFP-Occludin and ZO-1 (B). Scale bars: 50 µm. (C,D) OCLNWT, OCLNDM, OCLNT403/404A, OCLNT403/404D, OCLNY398/402A and OCLNY398/402D cell monolayers on transwell inserts were incubated with LCM for 16 h and TER (C) and FITC-inulin flux (D) were measured. Values are means± s.e.m. (n=6). Asterisks indicate the values that are significantly (P<0.05) different from corresponding values for OCLNWT cell monolayers. (E–G) FRAP analysis of EGFP was performed in OCLNWT (WT), OCLNDM (DM), OCLNT403/404A (T2A), OCLNT403/404D (T2D), OCLNY398/402A (Y2A) and OCLNY398/402D (Y2D) cell monolayers. Time-lapse images were collected before and after photobleaching of several ROIs at intercellular junctions. Fluorescence intensity was measured (E) and % mobile fraction (F) and t1/2 values (G) were calculated. Values are means±s.e.m. (n=4). Asterisks indicate the values that are significantly (P<0.05) different from the value for OCLNWT cell monolayers.

