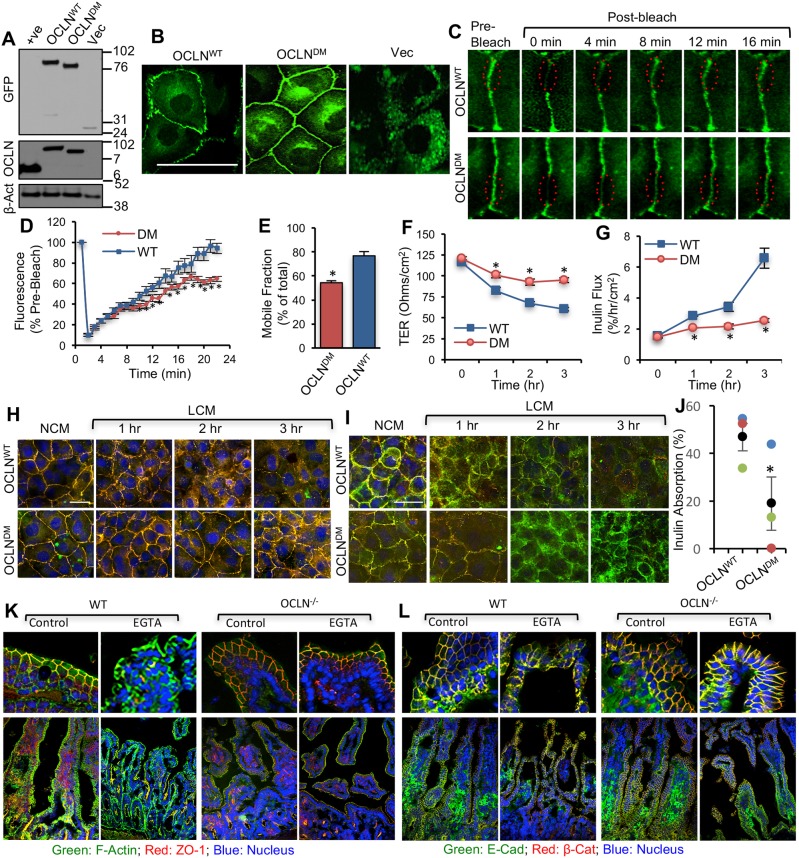
Fig. 7.
Deletion of ORM attenuates occludin mobility and Ca2+-depletion-mediated disruption of the AJC in the intestinal epithelium. (A,B) Total protein extracts from IEC-6 cells expressing EGFP-OCLNWT, EGFP-OCLNDM and EGFP vector (Vec) were immunoblotted for EGFP, occludin and β-actin (β-Act) (A). OCLNWT, OCLNDM and Vec cell monolayers were imaged live for EGFP (B). (C–E) FRAP analysis of EGFP was performed in OCLNWT (WT) and OCLNDM (DM) cell monolayers. Time-lapse images of several ROIs at intercellular junctions were collected before and after photobleaching (C). Fluorescence intensity in the bleached area was measured (D) and percentage mobile fractions of OCLNWT and OCLNDM were calculated (E). Values are means±s.e.m. (n=8). Asterisks indicate values that are significantly (P<0.05) different from the value for OCLNWT cells. (F,G) OCLNWT and OCLNDM cell monolayers on transwell inserts were incubated in LCM, and TER (F) and FITC-inulin flux (G) were measured at various time points. Values presented in the graph are means±s.e.m. (n=6). Asterisks indicate the values that are significantly (P<0.05) different from corresponding values for the OCLNWT group. (H,I) Fixed cell monolayers were stained for TJ proteins EGFP-occludin and ZO-1 (H) or AJ proteins E-cadherin and β-catenin (I). (J-L) Intestinal loops (∼2 cm long) from the mid small intestine of wild-type (WT) and occludin-deficient (OCLN−/−) mice were prepared and filled with saline containing FITC-inulin with or without 1 mM EGTA. Loss of inulin from the loops was measured after 30 min incubation in DMEM (J). Values are means±s.e.m. (n=3). The asterisk indicates the value for the OCLN−/− group that is significantly (P<0.05) different from the value for the WT group. Cryosections of the loops were immunostained for ZO-1, F-actin and nucleus (K) or E-cadherin and β-catenin (L). Scale bars: 50 µm.

