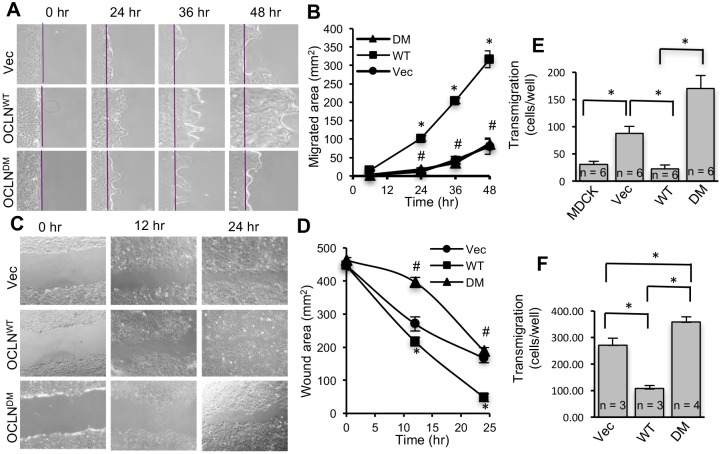
Fig. 8.
Absence of ORM impairs directional cell migration in renal and intestinal epithelia. (A,B) OD-MDCK cells expressing EGFP-OCLNWT (WT), EGFP-OCLNDM (DM) and EGFP vector (Vec) were grown to confluence, and cell migration assay was performed by scrape wounding. Phase-contrast images were captured at various time points (A); the purple lines indicate the origin of migration. Area of migration was measured using ImageJ and presented in arbitrary units (B). Values are means±s.e.m. (n=5; each value is an average of five images from the same monolayer). Asterisks indicate the values that are significantly (P<0.05) different from corresponding values for Vec cells, and the hash signs indicate the values that are different from corresponding values for EGFP-OCLNWT cells. (C,D) IEC-6 cells expressing EGFP-OCLNWT (WT), EGFP-OCLNDM (DM) and EGFP vector (Vec) were grown to confluence, and cell migration assay was performed by scratch wounding. Phase-contrast images were captured at 12 h or 24 h (C). The wound area was measured using ImageJ and presented in arbitrary units (D). Values are means±s.e.m. (n=5; each value is an average of five images from the same monolayer). Asterisks indicate the values that are significantly (P<0.05) different from corresponding values for Vec cells, and the hash signs indicate the values that are different from corresponding values for EGFP-OCLNWT cells. (E,F) OD-MDCK cells (E) and IEC-6 cells (F) expressing EGFP vector (Vec), EGFP-OCLNWT (WT) or EGFP-OCLNDM (DM) (105 cells /well), and MDCK cells (E) were seeded at low density on to transwells. Cells that migrated to the bottom surface of transwells were counted (E). Similar to MDCK cells, IEC-6 cells transfected with EGFP vector (Vec), EGFP-OCLNWT (WT) or EGFP-OCLNDM (DM) were seeded on to transwells to measure transmigration (F). Values are means±s.e.m., and the values within the bars are the number of samples per group. Asterisks indicate significant differences (P<0.05) between the groups.

