Fig. 6.
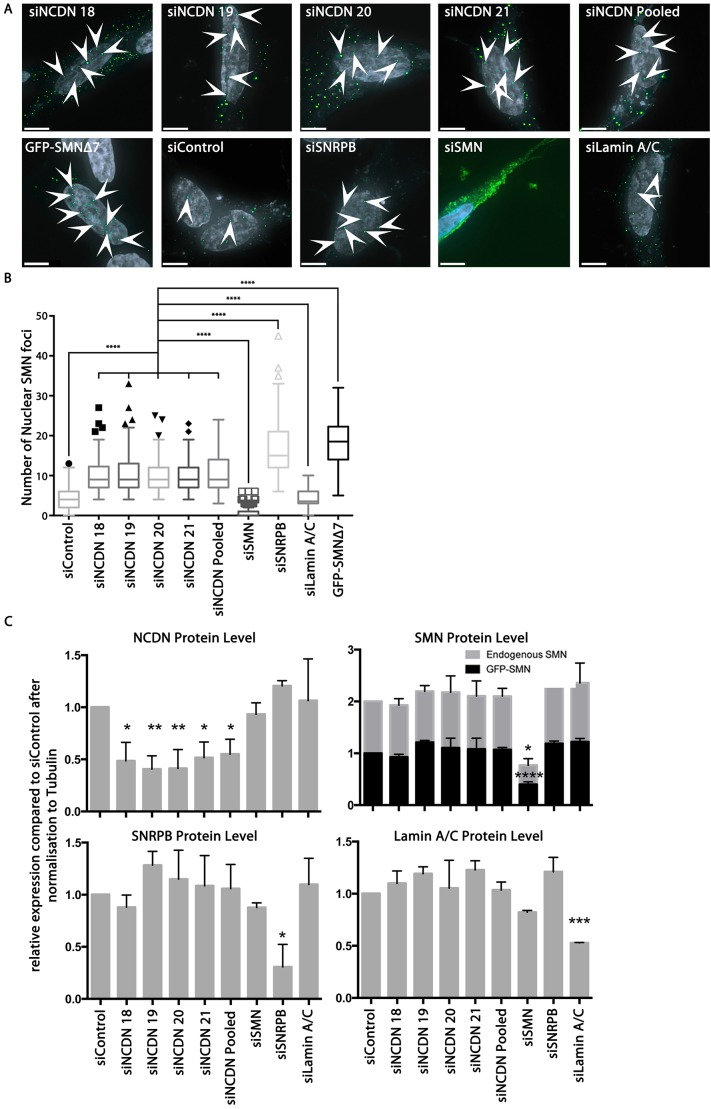
Reduction of endogenous NCDN through siRNA increases localisation of SMN to nuclear foci. (A) Transfection of SH-SY5Y cells constitutively expressing GFP–SMN (green) with siRNAs shows an increase in the number of SMN-positive nuclear foci (arrowheads) in cells transfected with siRNAs against NCDN (siNCDN, pooled represents all four siRNA molecules together) or SNRPB (siSNRPB), and a decrease in the number of SMN-positive nuclear foci in cells transfected with siRNAs against SMN (siSMN) in comparison to cells transfected with non-targeting siRNAs (siControl) or siRNAs against lamin A/C (siLamin A/C) as a ‘targeting’ control. Transfection of SH-SY5Y cells with a plasmid to express GFP–SMNΔ7 also results in increased numbers of SMN-positive nuclear foci. Cell nuclei are stained with Hoechst 33342 (grey on images). Transfection efficiency with siRNAs was greater than 90%, measured by transfection with siGlo Cyclophillin B (data not shown). Scale bars: 7 µm. Images are deconvolved z-stacks taken with 0.2 µm spacing. (B) Quantification of numbers of SMN-positive nuclear foci per nucleus showing that there is a significant increase following reduction of NCDN [10.2 (±4.1) with siNCDN 18, 10.4 (±5.0) with siNCDN 19, 9.9 (±4.1) with siNCDN 20, 9.5 (±3.6) with siNCDN 21, and 10.7 (±4.6) with siNCDN pooled] compared to 4.4 (±2.5) in cells treated with non-targeting siRNA (siControl) and 4.2 (±2.3) in cells treated with siRNAs targeting lamin A/C (siLaminA/C). Reduction of SNRPB also shows an increase in numbers of SMN-positive nuclear foci [to 16.7 (±6.8) with siSNRPB], while reduction of SMN leads to a decrease in numbers of SMN-positive nuclear foci [to 0.7 (±1.4) with siSMN]. Expression of GFP–SMNΔ7 results in an increase of numbers of SMN-positive nuclear foci to 18.2 (±5.3). All values are mean±s.d. The difference between each siNCDN and controls is statistically significant (AVOVA; P<0.0001, n=150 from 3 replicates). The box represents the 25–75th percentiles, and the median is indicated. The whiskers show the range of the data excluding outliers identified by the Tukey method. A Tukey post-test identified outliers (individual points marked on graph). (C) Immunoblot analysis using antibodies to endogenous NCDN, SMN and SNRPB shows a reduction in expression of each of 40–60% compared to siControl cells, after signals were normalised to tubulin (also see Fig. S4). Reductions in protein expression (mean±s.d.) compared to siControl siRNA are statistically significant (ANOVA; P<0.0001 for NCDN, Lamin A/C and endogenous SMN; P<0.001 for SNRPB; P<0.01 for GFP–SMN, n=3). A Dunnett post-test identified the significance of the reduction compared to siControl. *P≤0.05, **P≤0.01, ***P≤0.001, ****P≤0.0001.

